May 28, 2020
Research Publication
Multiple Factors Predict Higher Child Care Costs for Low-Income Hispanic Households
Authors:


Overview
Cost is a key factor shaping families’ decisions about whether and when to use different types of child carea arrangements for children.1 Recent federal guidelines suggest that affordable child care should cost no more than 7 percent of a family’s income.2 Yet, national analyses indicate that the average market price of formal child care (e.g., centers and licensed or regulated family child care) exceeds the recommended benchmark of affordability in every state in the United States.3
For Hispanicb households, which tend to have high levels of employment4 as well as low levels of income,5,6 finding affordable child care options that meet both parents’ and children’s needs may be especially challenging. In an earlier brief, we reported that although approximately 6 out of 10 low-income Hispanic households with children in care pay no out-of-pocket costs, fewer than 1 out of 10 pay affordable costs according to the federal benchmark of 7 percent or less of income—and more than 3 out of 10 pay costs that exceed this threshold. Moreover, we found that households in the latter category spend, on average, nearly one-third of their income on child care.7
In the current brief, we draw on data from the 2012 National Survey of Early Care and Education (NSECE) to extend this earlier work and explore how various characteristics of households, communities, and nonparental care arrangements predict different levels of child care spending for a national sample of low-income Hispanic households with young children (birth to age 5). Recognizing that such factors do not operate in isolation, we use a statistical method—multivariate ordinal regression—that allows us to consider multiple characteristics simultaneously while estimating the relative contribution of each one in predicting the percentage of income that Hispanic households spend to meet their child care needs.
Key Findings
Together, our findings suggest that child care affordability for low-income Hispanic households is a function of multiple characteristics of household composition, employment and economic status, community, and child care arrangements. Notably, several characteristics that might otherwise be associated with economic mobility (e.g., dual-earner households, low poverty, and suburban communities) are also linked to higher child care spending for low-income Hispanic households, signaling that opportunities for these families may come with additional costs.
Low-income Hispanic households are more likely to pay a larger share of their income on child care if they:
- Have an infant or toddler
- Are headed by a single parent
- Include working parents, especially more than one
- Receive public assistance
- Live in a low-poverty community
- Live in a suburban community
- Use multiple care providers
- Use center-based care arrangements
Low-income Hispanic households are less likely to pay a larger share of their income on child care if they:
- Include a co-resident grandparent
Factors found to be unrelated to low-income Hispanic households’ level of child care spending were the presence of older children in the home, availability of a nearby relative to provide care, household immigrant status and English proficiency, nonstandard parental work hours, household income level, and total hours of child care used per week.
How We Measured Household Child Care Costs
There are multiple ways to measure and discuss child care costs and affordability for families, including market prices and dollar amount spent. In this brief, we focus on households’ out-of-pocket child care costs as a percentage of their total income. We use the affordability benchmark of 7 percent of household income as recommended by the U.S. Department of Health and Human Services (HHS)2 to identify the following categories of child care spending:
- No costs. Households that pay no out-of-pocket costs for their current child care arrangements
- Low, affordable costs. Households that pay out-of-pocket costs equivalent to 7 percent or less of their total income
- High, unaffordable costs. Households that pay out-of-pocket costs equivalent to more than 7 percent of their total income
Using these categories, we then examine which household composition, employment and economic status, community, and child care characteristics predict the likelihood of households spending a larger (vs. smaller) percentage of their income on child care.
Findings
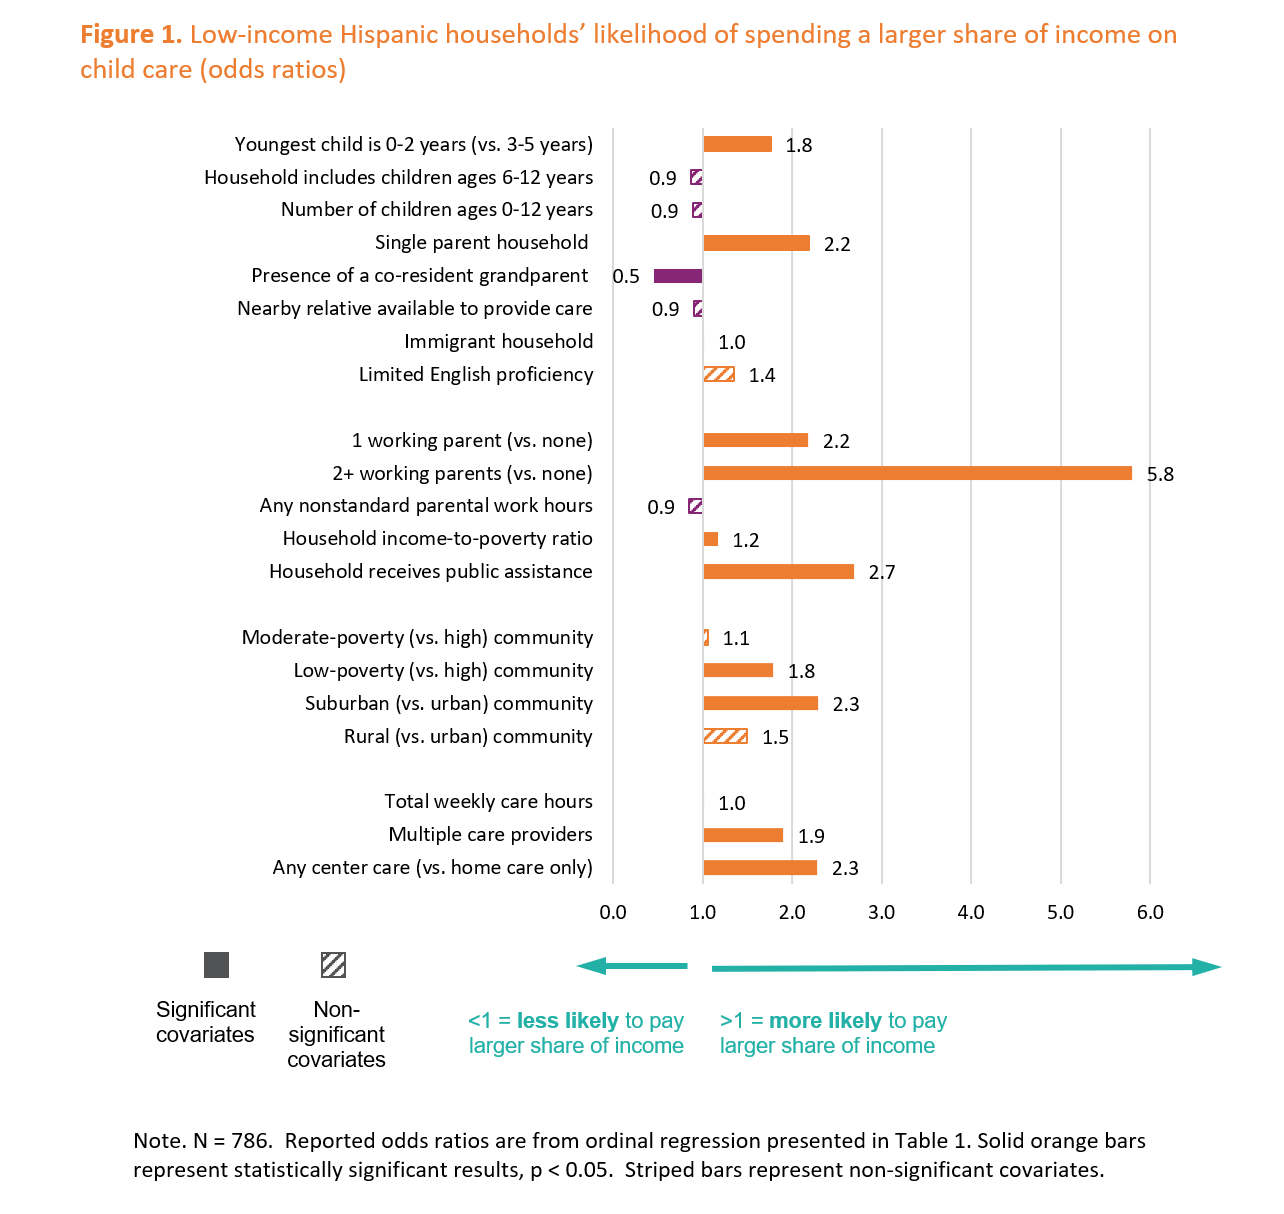
Regression results—indicating how the likelihood of being in a higher child care cost category changes in the presence of particular household, employment, economic, community, and child care characteristics—are summarized in Figure 1 using odds ratios and detailed in Table 1. Odds ratios greater than 1 indicate a higher likelihood of the outcome, whereas odds ratios less than 1 indicate a lower likelihood of the outcome. The numerical value of the odds ratio indicates the percentage change in the odds; for example, an odds ratio of 1.5 means the predictor is associated with a 50 percent increase in the odds of a household spending a higher percentage of their income on child care.
Household characteristics
Low-income Hispanic households’ level of spending on child care (as a percentage of their income) varies by the age of children living in the home, and who else resides there.
As shown at the top of Figure 1 and in the first row of Table 1, when all other characteristics are held constant, the presence of an infant or toddler roughly doubles the odds of a household spending a larger percentage of their income on child care; this is also the case for households that have only one resident parent. On the other hand, having a co-resident grandparent reduces the odds of higher spending on care by 50 percent.
Employment and economic characteristics
Parental employmentc is also associated with child care spending such that the odds of paying higher child costs are more than two times greater when there is at least one employed parent in the home versus none, and the odds are nearly six times greater when there are two (or more) working parents in the home. Notably, although household income level does not predict different levels of child care spending, household receipt of public assistance does. The odds of paying higher out-of-pocket costs are more than two and a half times greater for households that report receiving the Special Supplemental Nutritional Program for Women, Infants, and Children (WIC); the Supplemental Nutrition Assistance Program (SNAP); or free/reduced-price school meals than for households that do not receive these forms of assistance.
Figure 1. Low-income Hispanic households’ likelihood of spending a larger share of income on child care (odds ratios)
Community characteristics
We also find that the percentage of household income spent on child care by low-income Hispanics varies according to both the poverty density and urbanicity of the community in which they live. Low-income Hispanic households living in low-poverty communities are more likely to pay a larger percentage of their income on child care than those living in high-poverty communities. In addition, the odds of paying higher costs are more than two times greater for households located in suburban versus urban communities.
Child care arrangement characteristics
The final set of predictors of household spending on child care included in the model capture aspects of the nonparental care arrangements used by families. We find that the likelihood of paying a higher percentage of income on child care is not predicted by the total number of nonparental care hours used by the household, but rather by the number of different providers being used and whether any of their arrangements are center-based. Households using multiple providers are more likely than those using a single provider to be in a higher spending category, as are households using center-based arrangements (exclusively or in combination with home-based arrangements) compared to those using home-based care only. Each of these characteristics roughly doubles the odds that a household will be in a higher child care spending category.
Table 1. Ordinal regression predicting level of child care spending for low-income Hispanic households with children ages 0–5

Discussion
Recent data from multiple sources clearly show that child care affordability is an ongoing challenge for many American families. While federal guidelines suggest that affordable child care should require no more than 7 percent of household income,2 national data show that the average U.S. family with young children in care spends nearly 10 percent of their income on this critical work support, and this percentage is highest among low-income families.8 In addition, supply-side analyses of market prices for licensed child care—which tends to be of higher quality than less formal arrangements—indicate that average costs exceed the affordability benchmark in every state.3 Black and Latino parents may be disproportionately affected by affordability issues given that they tend to have lower earnings for similar levels of employment compared to White and Asian parents.9 Our own research has shown that among low-income Hispanic households with young children that pay something out-of-pocket for child care, the majority pay costs that are considered unaffordable according to federal guidelines.7 This level of spending may require difficult trade-offs for families and may be unsustainable over time.
In this brief, we use data from the 2012 National Survey of Early Care and Education to analyze the relative contribution of multiple characteristics of household composition, employment and economic status, community, and child care arrangements in predicting higher child care costs for a national sample of nearly 800 low-income Hispanic households. We conceptualize costs as the percentage of household income being spent on child care, and consider whether these costs fall above or below the federal affordability benchmark of 7 percent of income.
Interestingly, some of the most obvious or presumed drivers of child care costs—number of children (ages 0 to 12) in the home, household income level, and number of child care hours being used—did not emerge as significant predictors of the percentage of income being spent on care among low-income Hispanic households, suggesting a more complex story about the factors that affect child care affordability. We find that low-income Hispanics’ spending on child care varies by child age and how many adults are in the home, parents’ employment activity and receipt of public assistance, community urbanicity and poverty, and the number and types of child care arrangements being used. These factors likely shape families’ needs and preferences for care, but also influence the types of care options that are available to them. For example, we find that households with a child younger than age 3 are likely to spend a larger percentage of their income on care than families whose youngest child is age 3 to 5 years; this is consistent with the literature showing that infant and toddler care is more expensive than care for older children.10 In addition, households are likely to spend a larger percentage of their income on care when there is not a second parent or grandparent in the home.
In terms of employment and economic status, we find that having multiple working parents in the home is the strongest predictor of households spending a larger percentage of their income on child care. It is reasonable to expect that, compared to single-earner households, these households may need to access more hours of child care, and may have additional income to pay for care. However, our findings suggest that they are also paying a higher percentage of their income for the care they are using. We also find that, all else being equal, households that receive public assistance (in the form of WIC, SNAP, or free/reduced school meals) are more likely to spend a larger percentage of their income on child care than households that do not receive such assistance.
Despite relatively low overall rates of child care subsidy receipt for low-income Latinos,11 participation in other forms of public assistance may increase Hispanic households’ access to subsidized child care because these household may have greater awareness of public assistance programs and because programs may have similar eligibility criteria and/or one-stop application processes. Households using child care subsidies may ultimately incur higher out-of-pocket costs (due to copayments or requirements to purchase wrap-around care to cover care needs) than households that do not receive subsidies and instead exclusively rely on no- or low-cost informal arrangements. Another possibility is that when families have access to assistance programs that free up some resources that would otherwise cover basic needs (e.g., food), they may invest that money in purchasing more care or better quality/more preferred arrangements.
The finding that total hours of child care is not associated with different levels of out-of-pocket spending may seem unexpected, but it is consistent with our previously reported finding that the average number of care hours per week varied little across households paying no costs, low costs and high costs.7 The current set of findings suggests that the types of arrangements families may be able to access—because of whom they are seeking care for (e.g., infants and toddlers), who else is available in the home to provide care (e.g., another parent and/or a grandparent), and what arrangements may be available in their community—is a more significant driver of out-of-pocket costs.
Although weekly hours of care was not a significant predictor of child care spending level, the use of multiple care providers increased the likelihood of households spending a larger percentage of their income on care. This suggests potential affordability challenges for families that must piece together multiple arrangements to cover their care needs, such as for multiple children of different ages or for hours that extend beyond any one provider’s availability. For type of care, the other aspect of care we examined in relation to costs, we find that the use of center-based arrangements (alone or in conjunction with home-based arrangements) increased the likelihood of low-income Hispanic households spending a larger percentage of their income on care. Other findings from the 2012 NSECE indicate considerable use of center-based care by low-income Hispanic families, especially for preschool-aged children,12 suggesting that long-noted racial/ethnic gaps in center care use may be closing. Given their interest in and reliance on this type of care, low-income Hispanic families would benefit from efforts to increase its affordability.
Notably, several of our findings point to higher child care costs for low-income Hispanic households with characteristics that might otherwise be associated with economic mobility: having two (or more) working parents in the home, and living in low poverty and/or suburban communities. While these conditions might garner additional resources for Latino families and give them access to safer, better-resourced neighborhoods, there may be tradeoffs in terms of fewer affordable child care options. For example, in low-poverty and suburban communities, low-income families may have limited access to publicly funded early care and education programs (e.g., Head Start) or to no- or low-cost care provided by family or friends. Higher spending on care by low-income Hispanic households in better-resourced communities may represent access to higher-quality care settings; however, evidence suggests that the relationship between out-of-pocket costs and child care quality is not straightforward for low-income families. For one, the quality of low-cost publicly supported programs such as Head Start and public pre-K is highly variable.13 In addition, comparisons of quality among programs serving low-income children who are or are not receiving subsidies yield mixed findings.14 In other words, the current analysis, as well as the literature more broadly, does not shed light on the extent to which higher out-of-pocket spending among low-income Hispanic households reflects the purchase of higher quality care.
Several important caveats to this work point to directions for future research. First, because our analysis sample did not include multi-ethnic households that contain Hispanic members, the findings may not apply to this growing population. Latinos are the second-most likely group to marry someone of a different race/ethnicity.15 Our sample was also limited to households currently using nonparental care arrangements; thus, our analysis provides no information about the extent to which affordability issues play a role in low-income Hispanic families’ decisions not to use care or their inability to find needed care. In addition, some families with few or no out-of-pocket financial costs for care may “pay” for this care in non-monetary ways, for example, by purchasing groceries for caregivers. Low-income families’ use of a variety of non-cash payments to family, friends, and neighbors in exchange for child care has been described in qualitative research.16 Additional research on when and how low-income Hispanic households in different communities use this strategy would provide a more complete picture of the full “costs” of child care.
Finally, we note that the 2012 NSECE survey data do not allow us to disentangle whether families are using no- and low- cost arrangements because these arrangements suit child and parent needs, allow families to save money, and/or because no other options are accessible to them. In other words, we cannot discern how many families would select different care arrangements if they were available and affordable. Additional work is needed to better understand the child care decisions facing low-income Hispanic families living in different contexts.
About this Series
This brief is part of an ongoing series aimed at better understanding the early care and education experiences of Latino children. This brief uses data from the National Survey of Early Care and Education (NSECE)—a set of four integrated, nationally representative surveys that describe the ECE landscape in the United States. Other briefs in this series include:
- Child Care Affordability Is Out of Reach for Many Low-Income Hispanic Households (2019)
- Why and How Do Low-Income Hispanic Families Search for Early Care and Education (ECE)? (2018)
- Hispanic Children’s Participation in Early Care and Education: Type of Care by Household Nativity Status, Race/Ethnicity, and Child Age (2016)
- Hispanic Children’s Participation in Early Care and Education: Perceptions of Care Arrangements, and relatives’ Availability to Provide Care (2016)
Explore the rest of our work on early care and education for low-income Hispanic families
Data Source and Methodology
The 2012 National Survey of Early Care and Education (NSECE) is a set of four nationally representative surveys designed to describe the early care and education (ECE) landscape of the United States. The data presented in this brief are drawn from the NSECE household survey, which includes parent-reported information about ECE usage and costs for households with children under age 13. The NSECE oversampled in low-income areas, resulting in large numbers of low-income families.17
Given that families’ child care needs tend to be more extensive (and often more expensive) in the years before children begin formal schooling, we focus our analysis on 786 low-income Hispanic households with at least one child younger than age 6, that reported using nonparental care arrangements on a regular basis. For the purposes of this analysis, low-income is defined as household income below 200 percent of the federal poverty threshold in 2012 (adjusted for family size; $23,050 for a family of four).18 Hispanic households are defined as those where all members were identified by the respondent as being Hispanic (regardless of racial classification). Multi-ethnic households that contain both Hispanic and non-Hispanic members are excluded from this analysis given our interest in understanding the experiences of children and families when adult members who are Hispanic must navigate the low-wage labor market and early childhood care and education landscape (which includes providers, subsidy and other service provision systems). That our analysis cannot speak to the experiences of multi-ethnic Hispanic households is a limitation we address in the discussion.
To learn more about some of the factors associated with different levels of child care spending among low-income Hispanics, we conducted an ordinal regression model predicting the likelihood that households were in one of three spending categories: no out-of-pocket costs, affordable costs, or high/unaffordable costs (see definitions below). We base these categories on various characteristics of households, their employment and economic status, the types of the communities in which they live, and the types of care arrangements they use.d All analyses were conducted in STATA 16.0 and were weighted to be representative of U.S. households with children under 13 in 2012.
Appendix Table A provides descriptive information about the sample across the full set of characteristics included in the analysis. We present this information for the overall sample, and then separately for households in each of the three child care spending categories. Knowing the frequency of each characteristic and how it differs across cost groups at the bivariate level can provide context for understanding the multivariate results. Some associations between characteristics and child care costs observed at the bivariate level (when each characteristic is considered in isolation) do not emerge as significant in the multivariate analysis, which provides a more comprehensive test of how the characteristics relate to cost after accounting for the broader set of household, community, and child care characteristics. For example, as shown in Appendix Table A, households paying high costs are more likely than those paying no costs to have limited English proficiency when no other characteristics are considered. The regression analysis helps parse out whether this association is explained by other factors such as household composition or parental employment that may also predict child care spending and co-vary with household language status.
Definitions
Level of household spending on child care. Parents reported on out-of-pocket payments (not including any subsidy reimbursements) made by the household for each nonparental care arrangement used on a regular basis (five or more hours per week) for any child younger than age 13 living in the home. Dollar amounts were summed across arrangements to capture the total paid per week by the household, and this amount was then calculated as a percentage of total household income.e In line with an earlier report on child care costs using these data,7 we used the affordability benchmark of 7 percent as recommended by the U.S. Department of Health and Human Services (HHS)2 to identify three levels of household spending relative to income: 1) No out-of-pocket costs identifies households making no payments because they used care provided free of charge by individual caregivers (e.g., grandparent care), publicly funded programs such as Head Start and public pre-kindergarten, and/or arrangements fully subsidized with private or public funds (e.g., Child Care and Development Fund); 2) Low/affordable costs identifies households spending 7 percent or less of their income on care; and 3) High/unaffordable costs identifies households paying more than 7 percent of their income on care.
Household demographic characteristics. Multiple predictor variables were included in the analysis to capture aspects of household composition, nativity and language status, parental employment status and nonstandard work hours, and household financial resources. Dichotomous indicators were used to identify those households in which the youngest child was age 0 to 2 (vs. age 3 to 5), those that included children ages 6 to 12 (vs. not), those led by a single parent (vs. two), those with a co-resident grandparent (vs. not), and those with a relative living nearby who could provide child care (vs. not). Dichotomous indicators were also used to identify immigrant households (in which any member was foreign-born) and households in which English was not regularly spoken. To capture household employment activity, indicator variables were created to identify no working parent, one working parent, and two or moref working parents; and whether any parent worked some nonstandard hours (i.e., outside of 8:00 am–6:00 pm, Monday–Friday). Finally, a continuous measure of the household income-to-poverty ratio was included along with an indicator of whether the household was currently receiving public assistance in the form of WIC, SNAP food stamps, or free/reduced school meals.
Community characteristics. The NSECE team used census-tract variables from the 2005–2009 American Community Survey to construct multiple variables capturing the characteristics of communities where participating households were located. For this analysis, we used two such variables available in the NSECE public-use household datafile because of their potential implications for child care costs (because of differences in available care options, market rates for child care, and the availability of no- or low-cost arrangements). Community poverty density is represented by three indicators of poverty density that identify whether the household is located in a community where more than 20 percent (high), 13.9 to 20 percent (moderate), or less than 13.9 percent (low) of the population have income below the federal poverty threshold. Community urbanicity is represented by three indicators of whether the household is in a community classified as: 1) urban, with high urban density (.85 to 1.00 ratio of urban to total population); 2) suburban, with moderate urban density (.30 to .84 ratio); or 3) rural, with low urban density (.29 or less ratio).
Type of care arrangements. Participating households in the NSECE reported on all of the nonparental care arrangements being used on a regular basis for any child younger than age 13. For this analysis, we focus on two aspects of arrangements that may relate to higher levels of household spending on care: whether the household relies on multiple providers to cover their child care needs, and whether the household uses any center-based providers as part of their arrangements. Both of these indicators are coded dichotomously.g
Appendix Table A. Household, community, and child care characteristics for low-income Hispanic households with children ages 0–5, for the full sample and each child care cost group

Footnotes
a We primarily use the term “child care” in this brief rather than “early care and education” because some of the arrangements included in this household-level analysis of costs may be for school-age children.
b In this brief, we use the terms “Hispanic” and “Latino” interchangeably.
c In the NSECE, employment information was gathered for all parents, legal guardians and regular caregivers (10 or more hours per week) of children younger than age 13 in the household. In this brief, we use the term “parent” for simplicity.
d Ordinal regression carries the strong assumption that the effects of explanatory variables are consistent across categories (i.e., the change in odds of being in the low vs. no cost group are similar to those for the high vs. low or no cost groups). Given evidence that this assumption may be only partially met with these data, we also conducted a multinomial logistic regression, which yielded similar results. The ordinal logistic results are reported for the sake of parsimony.
e This percentage is often referred to in the literature as “child care cost burden”; however, we intentionally use terminology that recognizes the tradeoffs parents often make between cost, quality, proximity, and other factors. Some parents may view child care expenditures as an investment for their child and family.
f In the NSECE, employment information was gathered for all parents, legal guardians and regular caregivers (10 or more hours per week) of children younger than age 13 in the household. In this brief, we use the term “parent” for simplicity.
g Sensitivity analyses were conducted looking at multiple types of care arrangement “packages” used by households, namely center-based providers only, home-based providers only, and a combination of home- and center-based providers. These analyses suggest that the use of center-based arrangements (alone or in combination with home-based arrangements) is associated with higher costs; thus, the “any center care” indicator was retained as the most meaningful type of care predictor.
Suggested Citation:
Crosby, D., & Mendez, J. (2020). Multiple Factors Predict Higher Child Care Costs for Low-Income Hispanic Households. Report 2020-01. Bethesda, MD: National Research Center on Hispanic Children & Families. https://doi.org/10.59377/898f9744h
Acknowledgments
The authors would like to thank the Steering Committee of the National Research Center on Hispanic Children & Families, Erin Hardy, and staff from OPRE for their feedback on earlier drafts of this brief, as well as Sara Dean for her research assistance at multiple stages of this project.
Editor: Janet Callahan and Brent Franklin
Designer: Catherine Nichols
References
1 Chaudry, A., Henly, J. R., & Myers, M. (2010). Conceptual Frameworks for Understanding Child Care Decision- Making, OPRE White Paper. Washington, DC: Office of Planning, Research and Evaluation, Administration for Children and Families, U.S. Department of Health and Human Services. Retrieved from https://www.acf.hhs.gov/opre/resource/conceptual-frameworks-for-child-care-decision-making-white-paper
2 Administration for Children and Families, U.S. Department of Health and Human Services. (2016). Child Care and Development Fund (CCDF) Program. Federal Register, Vol 81, No. 190. Retrieved from https://www.govinfo.gov/content/pkg/FR-2016-09-30/pdf/2016-22986.pdf
3 Fraga, L. M., Dobbins, D. R., Draper, F., & McCready, M. (2017). Parents and the High Cost of Child Care: 2017. Arlington, VA: Child Care Aware of America. Retrieved from https://usa.childcareaware.org/wp-content/uploads/2017/12/2017_CCA_High_Cost_Report_FINAL.pdf
4 Wildsmith, E., Ramos-Olazagasti, M.A., & Alvira-Hammond, M. (2018). The Job Characteristics of Low-Income Hispanic Parents. Bethesda, MD: National Research Center on Hispanic Children & Families. Retrieved from https://hispanicrescen.wpengine.com/research-resources/the-job-characteristics-of-low-income-hispanic-parents/
5 Wildsmith, E., Alvira-Hammond, M., & Guzman, L. (2016). A National Portrait of Hispanic Children in Need. Bethesda, MD: National Research Center on Hispanic Children & Families. Retrieved from https://hispanicrescen.wpengine.com/publications/a-national-portrait-of-hispanic-children-in-need/
6 Gennetian, L., Rodriguez, C., Hill, H. D., & Morris, P. A. (2015). Income Instability in the Lives of Hispanic Children. Bethesda, MD: National Research Center on Hispanic Children & Families. Retrieved from https://hispanicrescen.wpengine.com/research-resources/income-instability-in-the-lives-of-hispanic-children/
7 Crosby, D., Mendez, J., & Barnes, A. (2019). Child Care Affordability Is Out of Reach for Many Low-Income Hispanic Households. Bethesda, MD: National Research Center on Hispanic Children & Families. Retrieved from https://hispanicrescen.wpengine.com/research-resources/child-care-affordability-is-out-of-reach-for-many-low-income-hispanic-households
8 Malik, R. (2019). Working Families Are Spending Big Money on Child Care. Washington, DC: Center for American Progress. Retrieved from https://www.americanprogress.org/issues/early-childhood/reports/2019/06/20/471141/working-families-spending-big- money-child-care/
9 Baldiga, M., Joshi, P., Hardy, E., & Acevedo-Garcia, D. (2018). Data-for-Equity Research Brief: Child Care Affordability for Working Parents. Waltham, MA: The Institute for Child, Youth and Family Policy. Retrieved from https://www.nichq.org/sites/default/files/resource-file/ChildCare%20Affordability%20brief.pdf
10 Workman, S., & Jessen-Howard, S. (2018). Understanding the True Cost of Child Care for Infants and Toddlers. Washington, DC: Center for American Progress. Retrieved from https://www.americanprogress.org/issues/early-childhood/reports/2018/11/15/460970/understanding-true-cost-child-care-infants-toddlers/
11 Walker, C., & Schmit, S. (2016). A Closer Look at Latino Access to Child Care Subsidies. Washington, DC: Center for Law and Social Policy. Retrieved from https://www.clasp.org/publications/report/brief/closer-look-latino-access-child-care-subsidies
12 Crosby, D.A., Mendez, J.L, Guzman, L. & López, M. (2016). Hispanic Children’s Participation in Early Care and Education: Type of Care by Household Nativity Status, Race/Ethnicity, and Child Age. Bethesda, MD: The National Research Center on Hispanic Children and Families. Retrieved from https://hispanicrescen.wpengine.com/research-resources/hispanic-childrens-participation-in-early-care-and-education-amount-and-timing-of-hours-by-household-nativity-status-race-ethnicity-and-child-age/
13 Philips, D.A. et al. (2017). The Current State of Scientific Knowledge on Pre-Kindergarten Effects. Washington, DC: Brookings Institution and the Duke Center for Child and Family Policy. Retrieved from https://www.brookings.edu/wp-content/uploads/2017/04/duke_prekstudy_final_4-4-17_hires.pdf
14 Forry, N., Daneri, P., & Howarth, G. (2013). Child Care Subsidy Literature Review. OPRE Brief 2013-60. Washington, DC: Office of Planning, Research and Evaluation, Administration for Children and Families, U.S. Department of Health and Human Services. Retrieved from https://www.acf.hhs.gov/sites/default/files/documents/opre/subsidy_literature_review.pdf
15 Livingston, G. & Brown, A. (2017). Intermarriage in the U.S. 50 Years After Loving v. Virginia. Washington, DC: Pew Research Center. Retrieved from https://www.pewsocialtrends.org/2017/05/18/intermarriage-in-the-u-s-50-years-after-loving-v-virginia/
16 Chaudry, A., Pedroza, J., Sandstrom, H., Danziger, A., Grosz, M., Scott, M. & Ting, S. (2011). Child Care Choices of Low-Income Working Families. Washington, DC: The Urban Institute. Retrieved from https://www.urban.org/research/publication/child-care-choices-low-income-working-families
17 National Survey of Early Care and Education Project Team. (2013). National Survey of Early Care and Education: Summary Data Collection and Sampling Methodology. OPRE Report #2013-46. Washington DC: Office of Planning, Research and Evaluation, Administration for Children and Families, U.S. Department of Health and Human Services. Retrieved from https://www.acf.hhs.gov/opre/resource/national-survey-of-early-care-and-education-summary-of-data-collection-and
18 Office of the Assistant Secretary for Planning and Evaluation, U.S. Department of Health and Human Services (2012). 2012 Poverty Guidelines, Federal Register Notice. Retrieved from https://aspe.hhs.gov/2012-poverty-guidelines-federal-register-notice