Apr 10, 2025
Research Publication
State TANF Policies and Practices, Administrative Burdens, and Latino Families
Authors:


Introduction
The United States has a complex array of safety net and income support programs aimed at reducing poverty. These social assistance programs provide supports for families with low incomes in a variety of ways, including cash assistance, refundable tax credits, in-kind benefits like food and housing, health care coverage, and direct services such as Head Start. However, not all families who are eligible for these programs apply for and receive benefits.
Participation varies substantially across programs and across demographics, including geography, race, ethnicity, and immigration status. Eligible Latinoa families tend to have lower participation rates in means-tested social assistance programsb than other racial and ethnic groups with similar rates of poverty. Latino children make up 1 in 4 children under age 19 and represent the largest racial and ethnic group of children living in poverty. Lower receipt of government benefits among Latino families may have implications for the economic resources available to Latino children and their future outcomes, given the impact of income on children’s future educational attainment, earnings, and physical and mental health.
Temporary Assistance for Needy Families (TANF), established by the Personal Responsibility and Work Opportunity Reconciliation Act of 1996, provides cash assistance and other services to families with children who have low incomes. TANF is allocated via block grants to states. While states must use the funds to support one of TANF’s four statutory purposes, states have wide latitude in how the funds are used to support those purposes. State latitude includes determining eligibility criteria for cash assistance, benefits and services provided, as well as application, enrollment, and recertification processes. This latitude may contribute to variation in how Latino families experience and access TANF cash assistance across states.
In this brief, we document variation in rates of TANF (Temporary Assistance for Needy Families) cash assistance receipt among Latino families across all states overall and after adjusting for differences in state-level poverty rates. While TANF is a federally administered program, states have considerable latitude to create policies and practices to administer benefits. We show how aspects of TANF cash assistance policy design and implementation practices, as informed by theories of administrative burden, vary among 11 states for which we have survey data from administrators and frontline workers. These 11 states (Arizona, California, Colorado, Connecticut, Louisiana, Nevada, New Mexico, North Carolina, Oregon, Pennsylvania, and an additional state that preferred to remain anonymous) include states with some of the highest populations of Latino children and families with low incomes; indeed, 45 percent of all Latino children in the United States reside in these 11 states. Our analysis is unique in applying the perspective of Latino families with children to policy design and on-the-ground practices across multiple states.c This work also builds on and contributes to the broader literature that has examined state policies and receipt of TANF cash assistance.
Summary of Findings
- Latino households with low incomes tend to have lower rates of TANF cash assistance receipt relative to non-Latino households with low incomes. Further, rates of TANF cash assistance receipt among Latino households vary substantially across the 50 states and District of Columbia. Our analyses provide insights into factors that may be contributing to this variation.
- When examining state-level variation, 100 percent of the variation across states in TANF receipt among the Latino population is due to factors other than differences in state-level poverty rates among the Latino population.d
- Differences in state policies and implementation practices may therefore be particularly influential for TANF cash assistance receipt among Latino families.
- Additionally, variation in rates of TANF receipt among Latino families is less tied to variation in state poverty than we see for other types of means-tested government benefits, such as the Supplemental Nutrition Assistance Program (SNAP) or Medicaid.
- The 11 states we have data for vary in levels of administrative burden with regard to both policy and implementation practice features.
- Among the 11 states, those with larger Latino populations tend to have higher TANF policy administrative burdens than those with smaller Latino populations.
- In contrast, among the 11 states surveyed, the size of Latino population does not vary closely with TANF practice administrative burdens.
- Three of the 11 states associated with high policy administrative burden were also associated with high practice administrative burden. Conversely, in 2 of the 11 states, administrative burden in TANF cash assistance practices were lower than administrative burden for TANF cash assistance policy. In these states, it is possible that on-the-ground practices—such as the availability of translators and frequent staff trainings on documentation guidance—could help mitigate the impact of policy variations on access to TANF cash assistance for Latino families.
About Administrative Burden
Eligible families may not receive benefits from government social assistance programs for several reasons. In this brief, we focus on complexities in and barriers to accessing program benefits for Latino families, as posited by theories of administrative burden. Theories of administrative burden—a term that has gained familiarity through the work of Pamela Herd, Donald Moynihan, and colleagues—call attention to the ways in which policymakers may create obstacles, intentionally or not, that negatively affect peoples’ encounters with public benefits and services. These ways include, for example, lengthy and multi-step application processes, onerous documentation and interview requirements, and lack of availability of on-site translators—each of which increase the amount of time, effort, and stress associated with learning about, applying for, maintaining access to, and interacting with government programs and program practitioners. These burdens can vary substantially from state to state, including for federal programs like TANF. While federally funded, TANF is administered at the state level, and states have latitude around some of the policies and practices that can facilitate or make it more difficult to know about and receive TANF cash assistance. Of particular interest for this brief are the elements of state and local TANF cash assistance policy design and implementation practices (i.e., outreach strategies, staffing and office features, document collection processes, etc.) that may make it easier or more difficult for eligible Latino families to access services. Policy design and implementation may contribute to variation in people’s access to programs and services for which they are eligible.
We developed two indices of administrative burden for TANF cash assistance: (1) the TANF cash assistance policy administrative burden index (“policy administrative burden index”), which reflects potential administrative burdens posed by state TANF cash assistance policies related to application processes and documentation and compliance requirements (normed across all states and the District of Columbia); and (2) the TANF cash assistance practice administrative burden index (“practice administrative burden index”), which reflects potential administrative burden posed by TANF cash assistance on-the-ground practices, as conveyed by administrators and frontline workers such as outreach, agency staff hiring, and staff training practices (normed across the 11 states that participated in our survey; see “Data and Methodology” section below and our working paper for more details). While the policy administrative burden index captures guidelines used by states (and counties) to determine TANF cash assistance, the practice administrative burden index captures implementation features from the perspective of administrators and frontline workers regarding their on-the-ground practices for enrolling and supporting families during the process of applying for and receiving benefits.
The on-the-ground practices that make up the practice administrative burden index are likely guided and shaped by TANF cash assistance policies but differ in that they may reflect—at least in part—TANF administrators’ and frontline workers’ training and daily interactions as they deliver and administer services. For example, each state may characterize its specific mission and goals for TANF differently, based on characteristics of the local communities they serve. The practice administrative burden index was specifically developed with the goal of capturing the experiences of serving Latino families (e.g., availability of application forms in Spanish), making it an especially useful tool for considering the unique daily experiences of Latino families who are interacting with TANF cash assistance.
Findings
Receipt of TANF cash assistance varies by ethnicity and by geography.
In 2019, Current Population Survey (CPS) estimates showed that 7.6 percent of all U.S. children living in households with incomes below the federal poverty level (FPL) received TANF cash assistance. Among households with children that had incomes below the FPL, fewer Latino households received TANF cash assistance than non-Latino households (Figure 1). Approximately 6.1 percent of Latino households with children and incomes below the federal poverty level (FPL) received TANF, compared to 8.3 percent of their non-Latino peers.
Figure 1. The rate of TANF cash assistance receipt among households with children and low income varies between Latino and non-Latino households.
Rate of TANF receipt in 2019 among Latino and non-Latino households with children and incomes below the federal poverty level (FPL), by ethnicity of the head of household

Source: Authors’ calculations, Current Population Survey, 2019
There is also considerable variation in TANF receipt across states among families of all ethnicities with incomes below the federal poverty level (ranging from less than a half a percent in Utah to nearly 27 percent in the District of Columbia; analysis not shown). State variation in TANF receipt may be due to differences across states in the share of families who are eligible for TANF cash assistance, or to a variety of other factors. We find that only 17 percent of the variation in TANF cash assistance receipt across states can be explained by variation in states’ prevalence of poverty (i.e., rates of poverty) and poverty intensity (i.e., the degree of poverty in a state as a percent of the FPL). This stands in contrast to other means-tested federal programs: For instance, about 65 percent of state variation in SNAP receipt and 72 percent of variation in Medicaid receipt across states are due to differences in poverty prevalence or intensity (see Figure 2). The relatively high share of variation in TANF receipt due to factors other than poverty prevalence and intensity (82%) points to the possible role of state-specific policies and implementation practices in influencing state variation in TANF program receipt.
Figure 2. In contrast to other federal programs, variation in TANF receipt rates across all states is mostly due to factors other than differences in poverty prevalence and intensity.
Percent of variation in TANF, SNAP, and Medicaid receipt rates in 2019 due to poverty prevalence, poverty intensity, or other factors
 Source: Authors’ calculations, Current Population Survey, 2019
Notes: Poverty prevalence refers to state poverty rates, while poverty intensity refers to degree of poverty (as a percent of the FPL) within a state. Other factors refer to state differences other than poverty prevalence or poverty intensity, such as differences in state policies and implementation practices.
However, when examining variation across states in TANF receipt specifically among Latino families, 100 percent of the variation is due to factors other than poverty prevalence or intensity (Figure 3). This means that differences in state policies and implementation practices may be particularly influential in affecting TANF cash assistance receipt among Latino families.
Figure 3. State variation in 2019 TANF receipt rates among Latino families was not explained by poverty prevalence and intensity.
Percent of variation in TANF receipt rates among Latino and non-Latino families with children and incomes below the FPL due to poverty prevalence, poverty intensity, or other factors
 Source: Current Population Survey, 2019
Notes: Poverty prevalence refers to state poverty rates, while poverty intensity refers to degree of poverty (as a percent of the FPL) within a state. Other factors refer to state differences other than poverty prevalence or poverty intensity, such as differences in state policies and implementation practices.
Differences in TANF policy features and on-the-ground practices in the 11 states we examined translated into considerable variation across these states in the degree of administrative burden Latino families likely experience.
Based on features of state TANF cash assistance policies and application procedures (see examples of items included in the Data and Methodology section below), we developed a TANF cash assistance policy administrative burden index. State scores on this index were normed across all 50 states and the District of Columbia, with positive scores indicating higher-than-average administrative burden and negative scores indicating lower-than-average administrative burden.
When considering individual indicators examined in this study as part of the policy administrative burden index, findings show that many states have taken efforts to reduce administrative burden. For instance, most or all of the 11 focal states have online applications (82%/n=9), use a combined application process that allows families to apply for TANF and at least one other support program via the same process (82%/n=9), or issue benefits through electronic benefit transfer (EBT) or electronic payment card (EPC) systems (100%/n=11). There was some variation in the estimated time needed to complete each state’s application, ranging from 25 to 65 minutes.
While many states have adopted policies that reduce administrative burden, there was still considerable variation in policy administrative burden index scores among the 11 examined states in ways that seem to correlate with the size of states’ Latino populations. Figure 4 shows policy administrative burden index scores for the 11 focal states, with states displayed in order of their Latino populations (California had the largest Latino population in 2019 and Louisiana had the lowest). States’ scores on the policy administrative burden index ranged from 1.5 standard deviations below the national norm for Pennsylvania, to nearly 2 standard deviations above the norm for North Carolina. Within these focal states, policy administrative burden index scores tended to be higher among states with the largest Latino populations (California, Arizona, New Mexico, North Carolina, and our anonymous state are collectively home to 36% of Latino children in the United States). The same was true when we compared policy administrative burden index scores across all states and the District of Columbia based on their Latino populations: States with higher Latino populations tended to have higher administrative burden and states with smaller Latino populations tended to have lower burden (Appendix Table A-2).
Figure 4. Administrative burden scores for TANF cash assistance policy varied considerably among the 11 focal states, with higher scores among states with larger Latino populations.
TANF policy administrative burden scores among the 11 focal states, where 0 represents the national average, 2019.
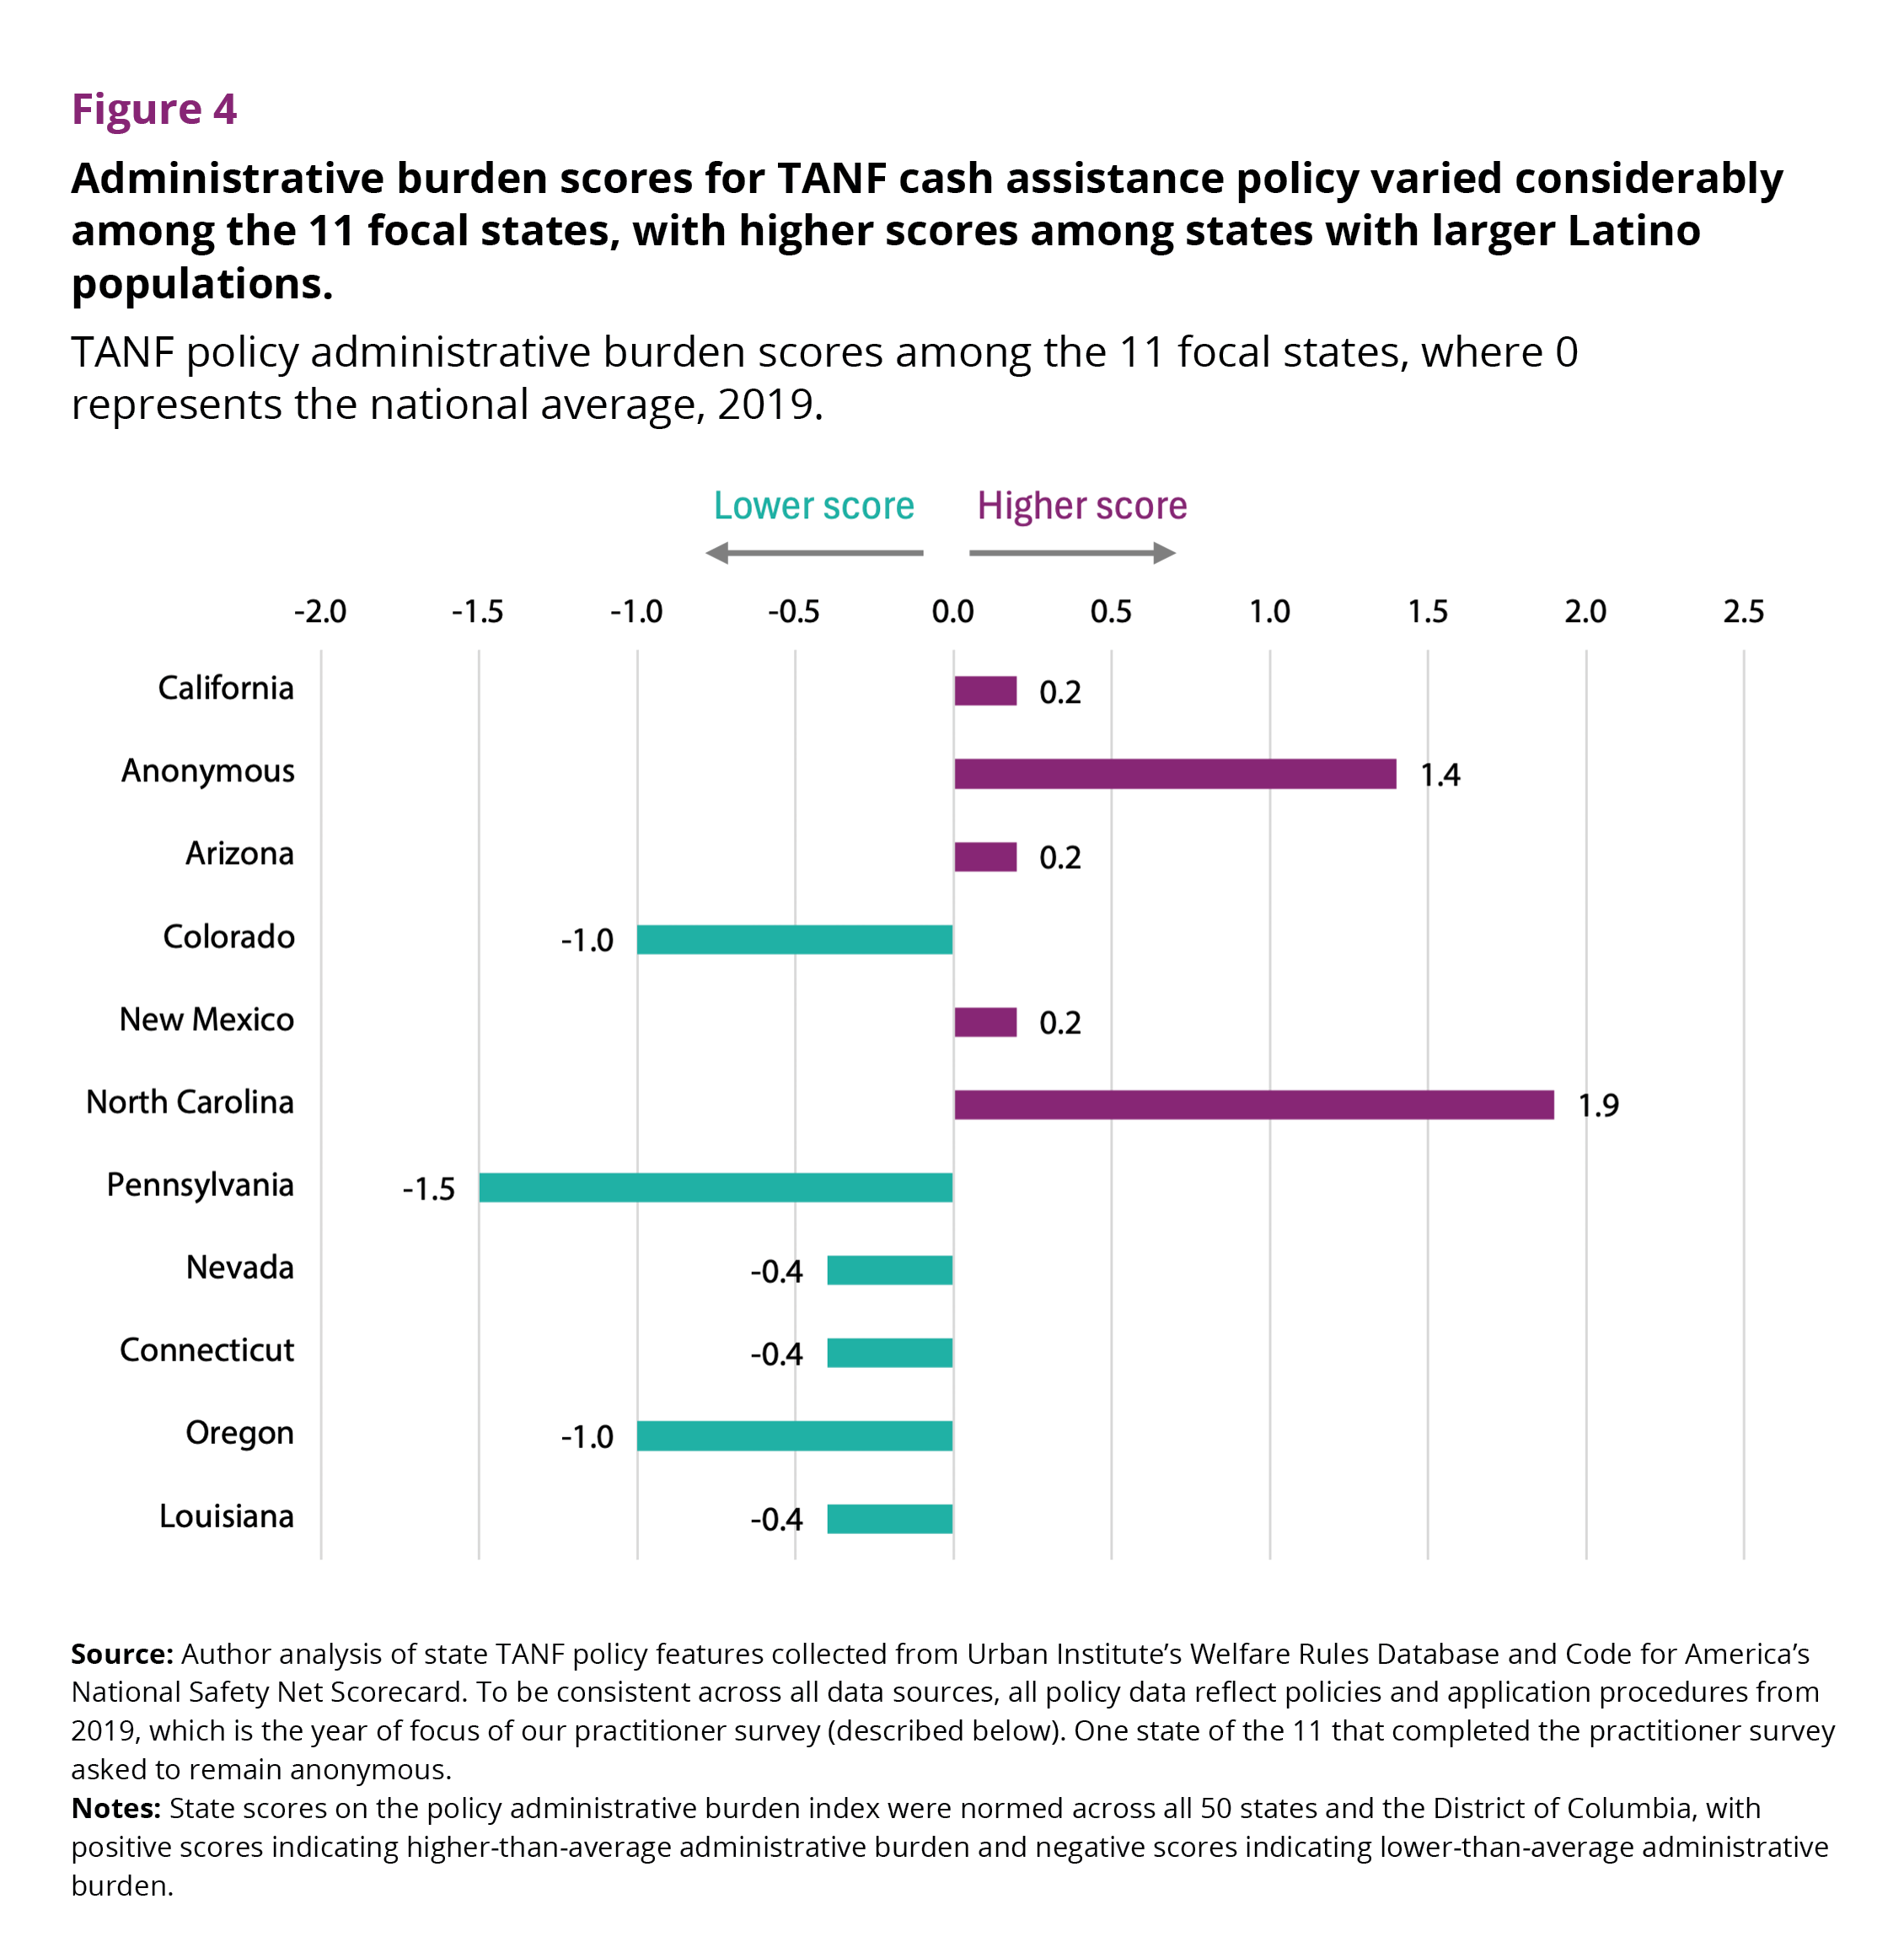 Source: Author analysis of state TANF policy features collected from Urban Institute’s Welfare Rules Database and Code for America’s National Safety Net Scorecard. To be consistent across all data sources, all policy data reflect policies and application procedures from 2019, which is the year of focus of our practitioner survey (described below). One state of the 11 that completed the practitioner survey asked to remain anonymous.
Notes: State scores on the policy administrative burden index were normed across all 50 states and the District of Columbia, with positive scores indicating higher-than-average administrative burden and negative scores indicating lower-than-average administrative burden.
Based on features of state TANF cash assistance on-the-ground practices (see Data and Methodology section below for examples of items included), we also developed a TANF cash assistance practice administrative burden index. Practice administrative burden scores were normed across the 11 states that participated in our survey. As with the aforementioned policy administrative burden index, positive scores on the practice administrative burden index indicate higher-than-average administrative burden and negative scores indicate lower-than-average administrative burden.
Among the 11 focal states, administrative burden posed by TANF implementation practices also varied substantially (see Figure 5), ranging from more than one standard deviation below the average in Nevada to nearly 2.5 standard deviations above the average in Louisiana. There was no consistent pattern with regard to administrative burden of TANF cash assistance practices and Latino population within the 11 states examined.
Figure 5. Administrative burden of TANF cash assistance implementation practices varied considerably among the 11 states irrespective of size of state Latino populations.
TANF practice administrative burden scores among the 11 focal states, where 0 represents the group average, 2019
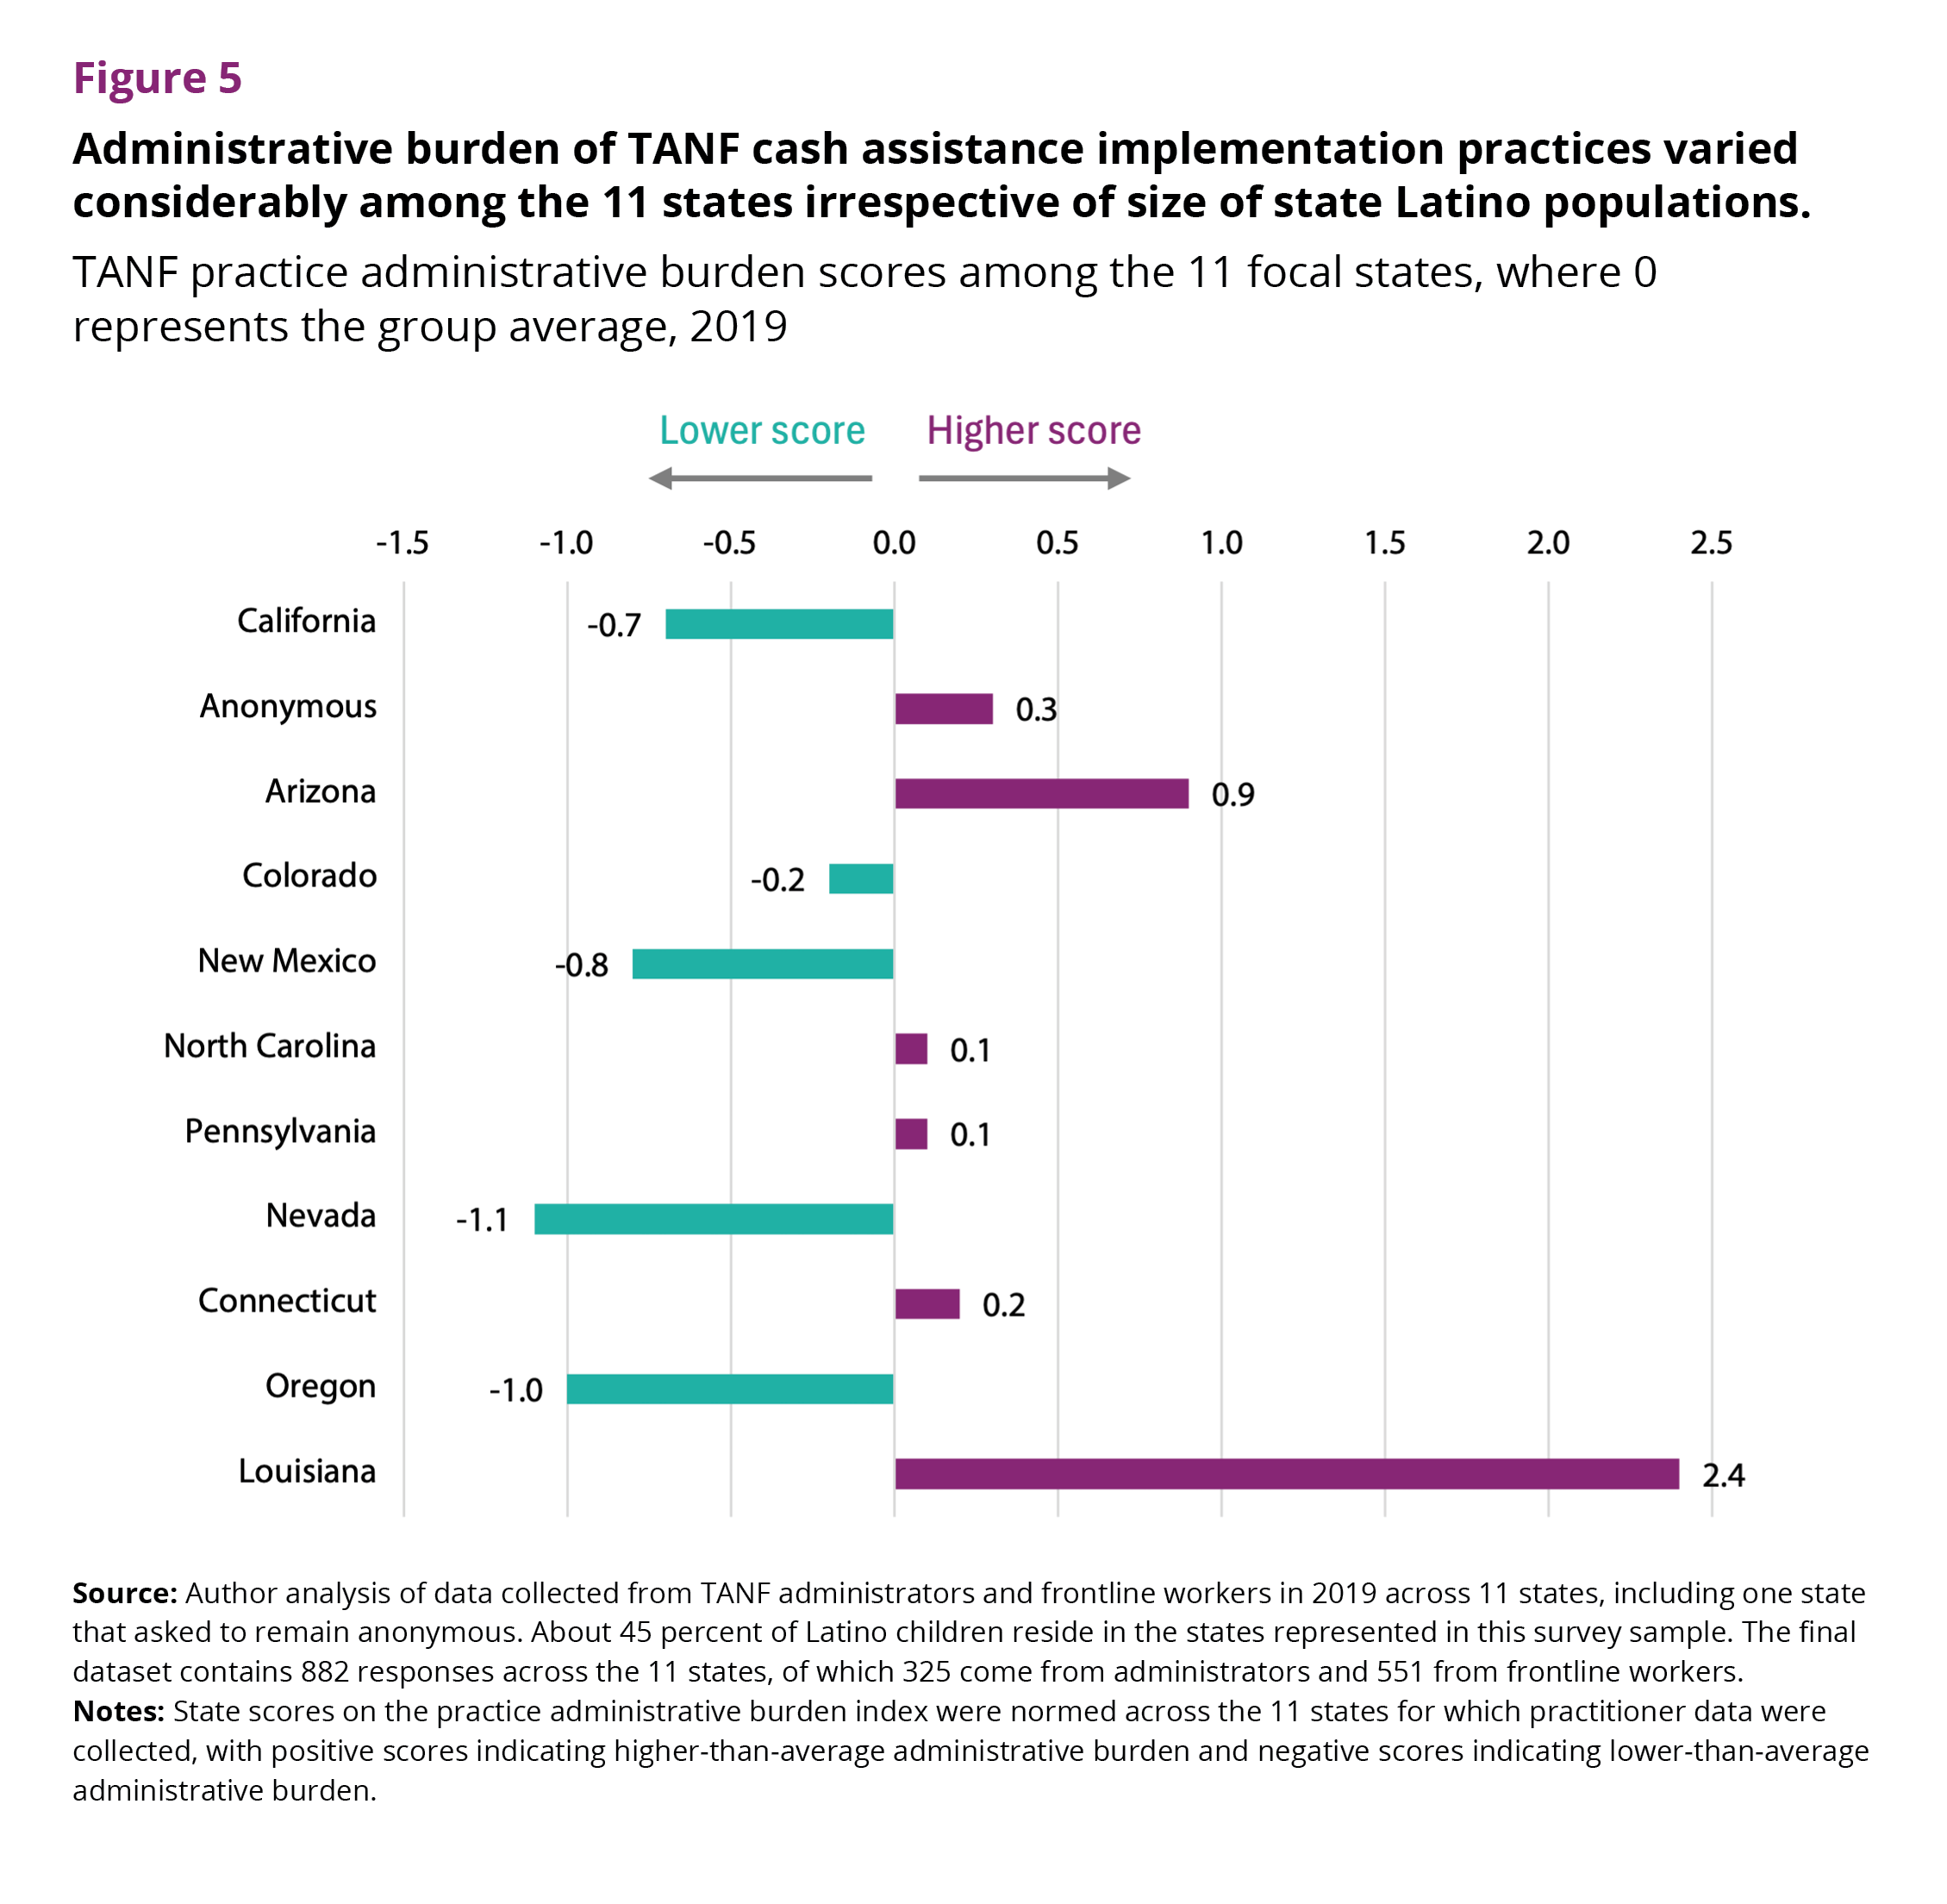
Source: Author analysis of data collected from TANF administrators and frontline workers in 2019 across 11 states, including one state that asked to remain anonymous. About 45 percent of Latino children reside in the states represented in this survey sample. The final dataset contains 882 responses across the 11 states, of which 325 come from administrators and 551 from frontline workers.
Notes: State scores on the practice administrative burden index were normed across the 11 states for which practitioner data were collected, with positive scores indicating higher-than-average administrative burden and negative scores indicating lower-than-average administrative burden.
Most states with low TANF policy administrative burden tend to also have low practice administrative burden, and vice versa; however, there are notable exceptions.
Figure 6 maps the correspondence between the TANF cash assistance administrative burden policy and practice indices for the 11 states for which data were available. Many states with low TANF cash assistance policy administrative burden tend to also have low TANF cash assistance practice administrative burden (e.g., Nevada, Oregon, Colorado), and vice versa (North Carolina, Arizona, and a state that wished to remain anonymous have both high policy and high practice administrative burden). However, nearly as many of the 11 states are discordant in their TANF cash assistance policy and practice administrative burden index scores.
In New Mexico and California, administrative burden is high in terms of TANF cash assistance policy (both have policy administrative burden index scores above the national average), but on-the-ground practices show a range of efforts (e.g., providing program information and applications in Spanish) that contribute to lower TANF cash assistance practice administrative burden scores (relative to the other states examined).
Figure 6. Most states with low TANF policy administrative burden tend to also have low practice administrative burden, and vice versa—with notable exceptions.
Relationship of 2019 TANF policy and practice administrative burden scores among the 11 focal states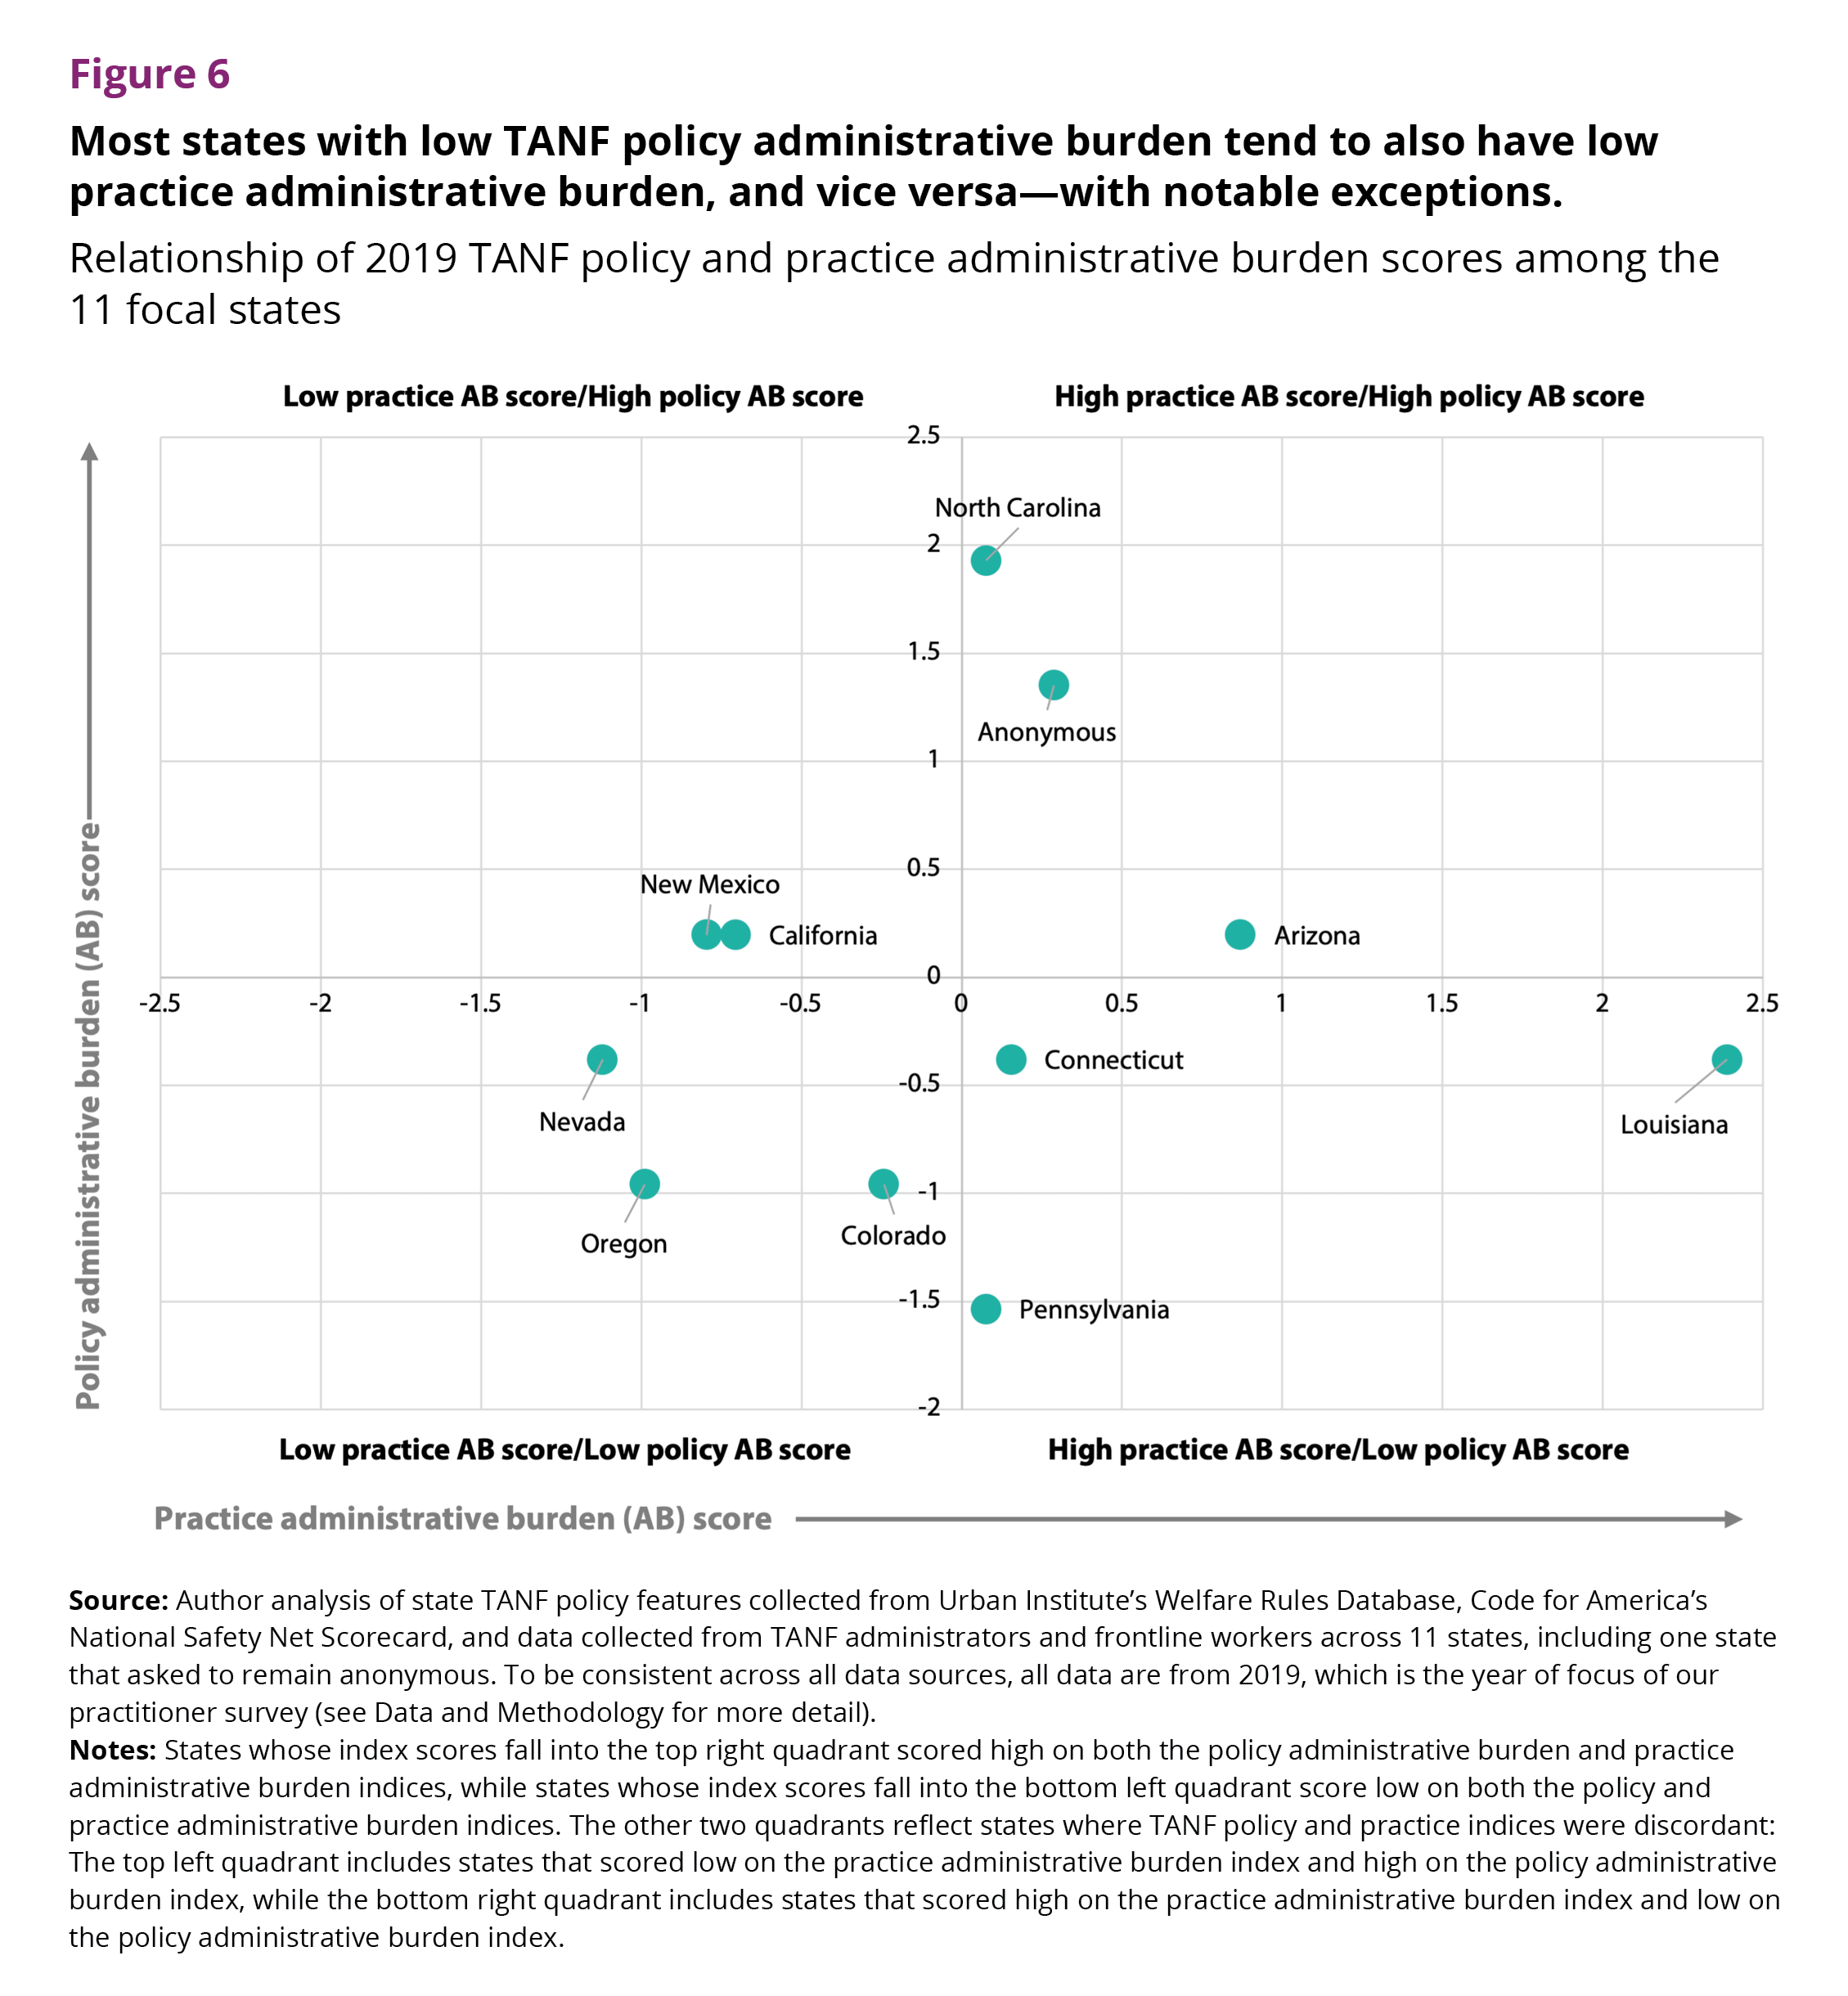
Source: Author analysis of state TANF policy features collected from Urban Institute’s Welfare Rules Database, Code for America’s National Safety Net Scorecard, and data collected from TANF administrators and frontline workers across 11 states, including one state that asked to remain anonymous. To be consistent across all data sources, all data are from 2019, which is the year of focus of our practitioner survey (see Data and Methodology for more detail).
Notes: States whose index scores fall into the top right quadrant scored high on both the policy administrative burden and practice administrative burden indices, while states whose index scores fall into the bottom left quadrant score low on both the policy and practice administrative burden indices. The other two quadrants reflect states where TANF policy and practice indices were discordant: The top left quadrant includes states that scored low on the practice administrative burden index and high on the policy administrative burden index, while the bottom right quadrant includes states that scored high on the practice administrative burden index and low on the policy administrative burden index.
Discussion and Conclusion
State-level rates of TANF cash assistance receipt vary considerably across the United States. This variation cannot be fully attributed to state variation in rates of poverty (whereas variation in poverty explains more of the variation in other types of means-tested government programs, such as SNAP and Medicaid). This suggests that other factors, including state and local policies and practices, may be important predictors of TANF cash assistance receipt. The lack of association between poverty rates and TANF receipt is especially true in states with high populations of Latino families with children; that is, in high Latino population states, state rates of TANF cash assistance receipt cannot be attributed to rates of poverty in that state.
A range of factors influence whether and why eligible Latino families apply for and receive TANF cash assistance benefits. In this brief, we have explored the role of state policy and practice by applying the framework of administrative burden with new data collected on state policies curated from publicly available sources and on practices by state administrators and frontline workers via a survey of practitioners from 11 states with large Latino populations.
We found that, in these 11 focal states—collectively home to 45 percent of Latino children in the United States—TANF cash assistance policies associated with administrative burden and TANF cash assistance practices associated with administrative burden varied substantially. States with larger Latino populations tended to have high TANF cash assistance policy burden. We also found that two of these 11 states (California and New Mexico) used on-the-ground practices related to TANF cash assistance implementation that may mitigate policy-generated administrative burdens. Such practices include providing program information and applications in Spanish, reducing the number of required documentation types, and conducting frequent staff trainings on documentation guidance.
Implications for policy, practice, and research
One can bring multiple perspectives to conceptualizing and measuring state and local policies and implementation practices. In this brief, we have offered one particular perspective rooted in the framework of administrative burden. The findings highlight ways for states to consider administrative burdens to meet objectives of improving program access:
- Features of state TANF cash assistance policies that may facilitate program receipt by way of reducing administrative burdens include the availability of online and combined application processes.
- Features of TANF cash assistance implementation practices that may reduce administrative burdens—including among Latino families—include providing program information and applications in Spanish, reducing the number of required documentation types, and conducting frequent staff trainings on documentation guidance.
While this brief has presented findings from an administrative burden lens, the broader work of this research project considers other frameworks as well—for example, an economically informed efficiency (or cost minimization) perspective to inform how scarce and limited government resources can meet programmatic aims in the face of high demand. In some cases, this perspective is aligned with strategies to reduce administrative burden: For example, online and combined application processes can be a cost-efficient means of reducing burden on program staff and families alike. In other cases, strategies to reduce burden on families (e.g., reducing office wait times) may incur costs on the programmatic side (e.g., the need to hire additional staff), and strategies that increase burden on families (e.g., more types of documentation required as part of the application process) may be seen as an efficient allocation of limited resources (e.g., ensuring limited resources are allocated to those who meet the requirements).
The next stage of this broader research agenda will be to quantify whether and how state policies and practices affect receipt of TANF cash assistance (and other government benefits) among Latino families with low incomes, and as such, financial resources available to families and Latino children’s well-being.
Data and Methodology
The TANF policy administrative burden index is based on data from multiple public sources. Information on state-specific TANF policies came from the Welfare Rules Database, which catalogues selected state policy differences for TANF cash assistance, including initial eligibility requirements, work and activity requirements, and ongoing eligibility and time limits. These data were supplemented by data on online accessibility of applications, use of combined application processes, and the time required to complete the application for all three programs, as compiled in Code for America’s National Safety Net Scorecard. To be consistent across all data sources, all policy data reflect policies and application procedures from 2019, which is the year of focus of our practitioner survey (described below). Examples of TANF policy administrative burdens include: not having an online application, not combining applications from different programs, having longer application completion time than other states, and not issuing benefits through electronic benefit transfer (EBT) or electronic payment card (EPC) systems. Examples of TANF administrative burdens include: not having application forms available in Spanish, requiring multiple types of documentation, having long TANF office wait times, and infrequent staff trainings on documentation requirements.
The TANF practice administrative burden index is based on data collected in 2019 from TANF administrators and frontline workers across 11 states with a high number of Latino families with low incomes. The practitioner survey was designed with a particular focus on capturing experiences or perspectives from a Latino lens. The survey captured six general themes related to factors that may shape Latino families’ experiences and perspectives interacting with staff and services in TANF offices, including organizational processes (e.g., language barriers, application processes), staff training and development, and economic climate and budgetary constraints. Practitioners from the following 11 states were successfully surveyed: Arizona, California, Colorado, Connecticut, Louisiana, North Carolina, New Mexico, Nevada, Oregon, and a state which requested to stay anonymous (referred to throughout as anonymous). While the 11 states that ultimately responded to the survey do not represent all states with the largest Latino populations, about 45 percent of all Latino children in the United States reside in these states. The final dataset contains 882 responses across the 11 states, of which 325 come from administrators and 551 from frontline workers.
States (or respondents within states, in the case of the practitioner survey) received a 1 for each indicator in which their policy or practice reflected higher levels of burden and a 0 otherwise (see above for examples of administrative burden included). For the practitioner survey, responses were averaged across respondents within a state. The respective state-level indices were then created by summing across all indicators in their respective index. For each index, we then created z-scores for each state, such that scores of 0 represent the average administrative burden across all states. Positive scores represent administrative burdens that are higher than average (e.g., a score of 1 would be one standard deviation above the mean), while negative scores represent administrative burdens that are lower than average (e.g., a score of -1 would be one standard deviation below the mean).
For a full description of the development of the policy and practice administrative burden indices, please see our working paper.
Footnotes
aWe use the terms “Hispanic” and “Latino” interchangeably throughout the brief. Consistent with the Office of Budget and Management’s (OMB) standards for data on race and ethnicity, these terms refer to individuals of Mexican, Puerto Rican, Salvadoran, Cuban, Dominican, Guatemalan, and other Central or South American or Spanish cultures or origins.
b Means-tested programs limit eligibility to individuals and families whose incomes and or assets fall below a pre-determined threshold (means test).
c One exception with a specific focus on North Carolina is Barnes and Gennetian.
d The present analysis explores differences in TANF cash assistance receipt, poverty rates, and state policy and practices at the state-level unit of analysis. The extent to which differences in TANF cash assistance at the state level are fully explained by factors other than state differences in poverty rates will depend on a variety of state, local, and family demographic characteristics. These other factors are considered in analyses at the family level in our companion papers (here and here).
Suggested Citation
Thomson, D., Padilla, C. M., Gennetian, L. A., Basurto, L., Rangal, M., Shukla, P., Yong, H., & Maxfield, E. T. (2025). State TANF Policies and Practices, Administrative Burdens, and Latino Families. DOI: 10.59377/621u5127l
Acknowledgements
The authors would like to thank the Steering Committee of the National Research Center on Hispanic Children & Families—along with Santiago Deambrosi, Kristen Harper, Melissa Perez, Laura Ramirez, and Andhrea Tagle Readi—for their helpful comments, edits, and research assistance at multiple stages of this project. The Center’s Steering Committee is made up of the Center investigators—Drs. Natasha Cabrera (University of Maryland, Co-PI), Danielle Crosby (University of North Carolina at Greensboro, Co-PI), Lisa Gennetian (Duke University; Co-PI), Lina Guzman (Child Trends, PI), Julie Mendez (University of North Carolina at Greensboro, Co-PI), and Maria Ramos-Olazagasti (Child Trends, Deputy Director and Co-PI)—and federal project officers Drs. Ann Rivera, Jenessa Malin, Kimberly Clum, and Shirley Huang (Office of Planning, Research and Evaluation).
This research was supported by a grant from the W. T. Grant Foundation and by the Administration for Children and Families (ACF) of the United States (U.S.) Department of Health and Human Services (HHS) as part of two financial assistance awards (Award # 90PH0028, from 2018-2023, and Award # 90PH0032 from 2023-2028) totaling $13.5 million across the two awards with 99 percentage funded by ACF/HHS and 1 percentage funded by non-government sources. The contents are those of the authors and do not necessarily represent the official views of, nor an endorsement, by the W.T. Grant, ACF/HHS, or the U.S. Government. For more information, please visit the ACF website, Administrative and National Policy Requirements.
Editor: Brent Franklin
Designers: Catherine Nichols and Joseph Boven
About the Authors
Dana Thomson, MS Ed., PhD, is a senior research scientist at Child Trends whose work focuses on services and programs that have the potential to strengthen child and family well-being, particularly for those experiencing economic hardship.
Christina M. Padilla, MPP, PhD, is a senior research scientist at Child Trends whose work focuses on two-generation programs that support parents/caregivers and children in low-resource contexts, including Head Start, home visiting, and programs that strengthen families’ economic well-being.
Lisa A. Gennetian, PhD, is a co-investigator of the National Research Center on Hispanic Children & Families, leading the research area on poverty and economic self-sufficiency. She is the Pritzker Professor of Early Learning Policy Studies at Duke University Sanford School of Public Policy. One of her research foci is income instability among children and families, the ways this is informed by theories emerging from behavioral economics, and implications for social policy and programs.
Luis E. Basurto is a PhD Student at Cornell University. His current research studies the impact of social safety net programs on various human development outcomes.
Marcos A. Rangel, PhD, is an Associate Professor of Public Policy and Economics at Duke University working on family decision making regarding child education and health in the context of racial and ethnic inequality.
Prachi Shukla, MSc, is a PhD Student at Duke University. Her research focuses on economics of the family, intra-household dynamics, labor and education.
Haocheng Yong, MA, is an analyst. His research interests include labor economics and economics of education.
Emily Theresa Maxfield, MEd, is a Research Scientist at Child Trends whose work examines social safety net policies, primarily CCDF policy.
About the Center
The National Research Center on Hispanic Children & Families (Center) is a hub of research to help programs and policymakers better serve low-income Hispanic children and families across three priority areas: poverty reduction and economic self-sufficiency; early care and education; and parenting, fatherhood, and family life. The Center is led by Child Trends, in partnership with Duke University, University of North Carolina at Greensboro, and University of Maryland, College Park.
Copyright 2025 by the National Research Center on Hispanic Children & Families.
Appendix
Figure A-1. State level variation in TANF policy administrative burden, overall and for 11 focal states
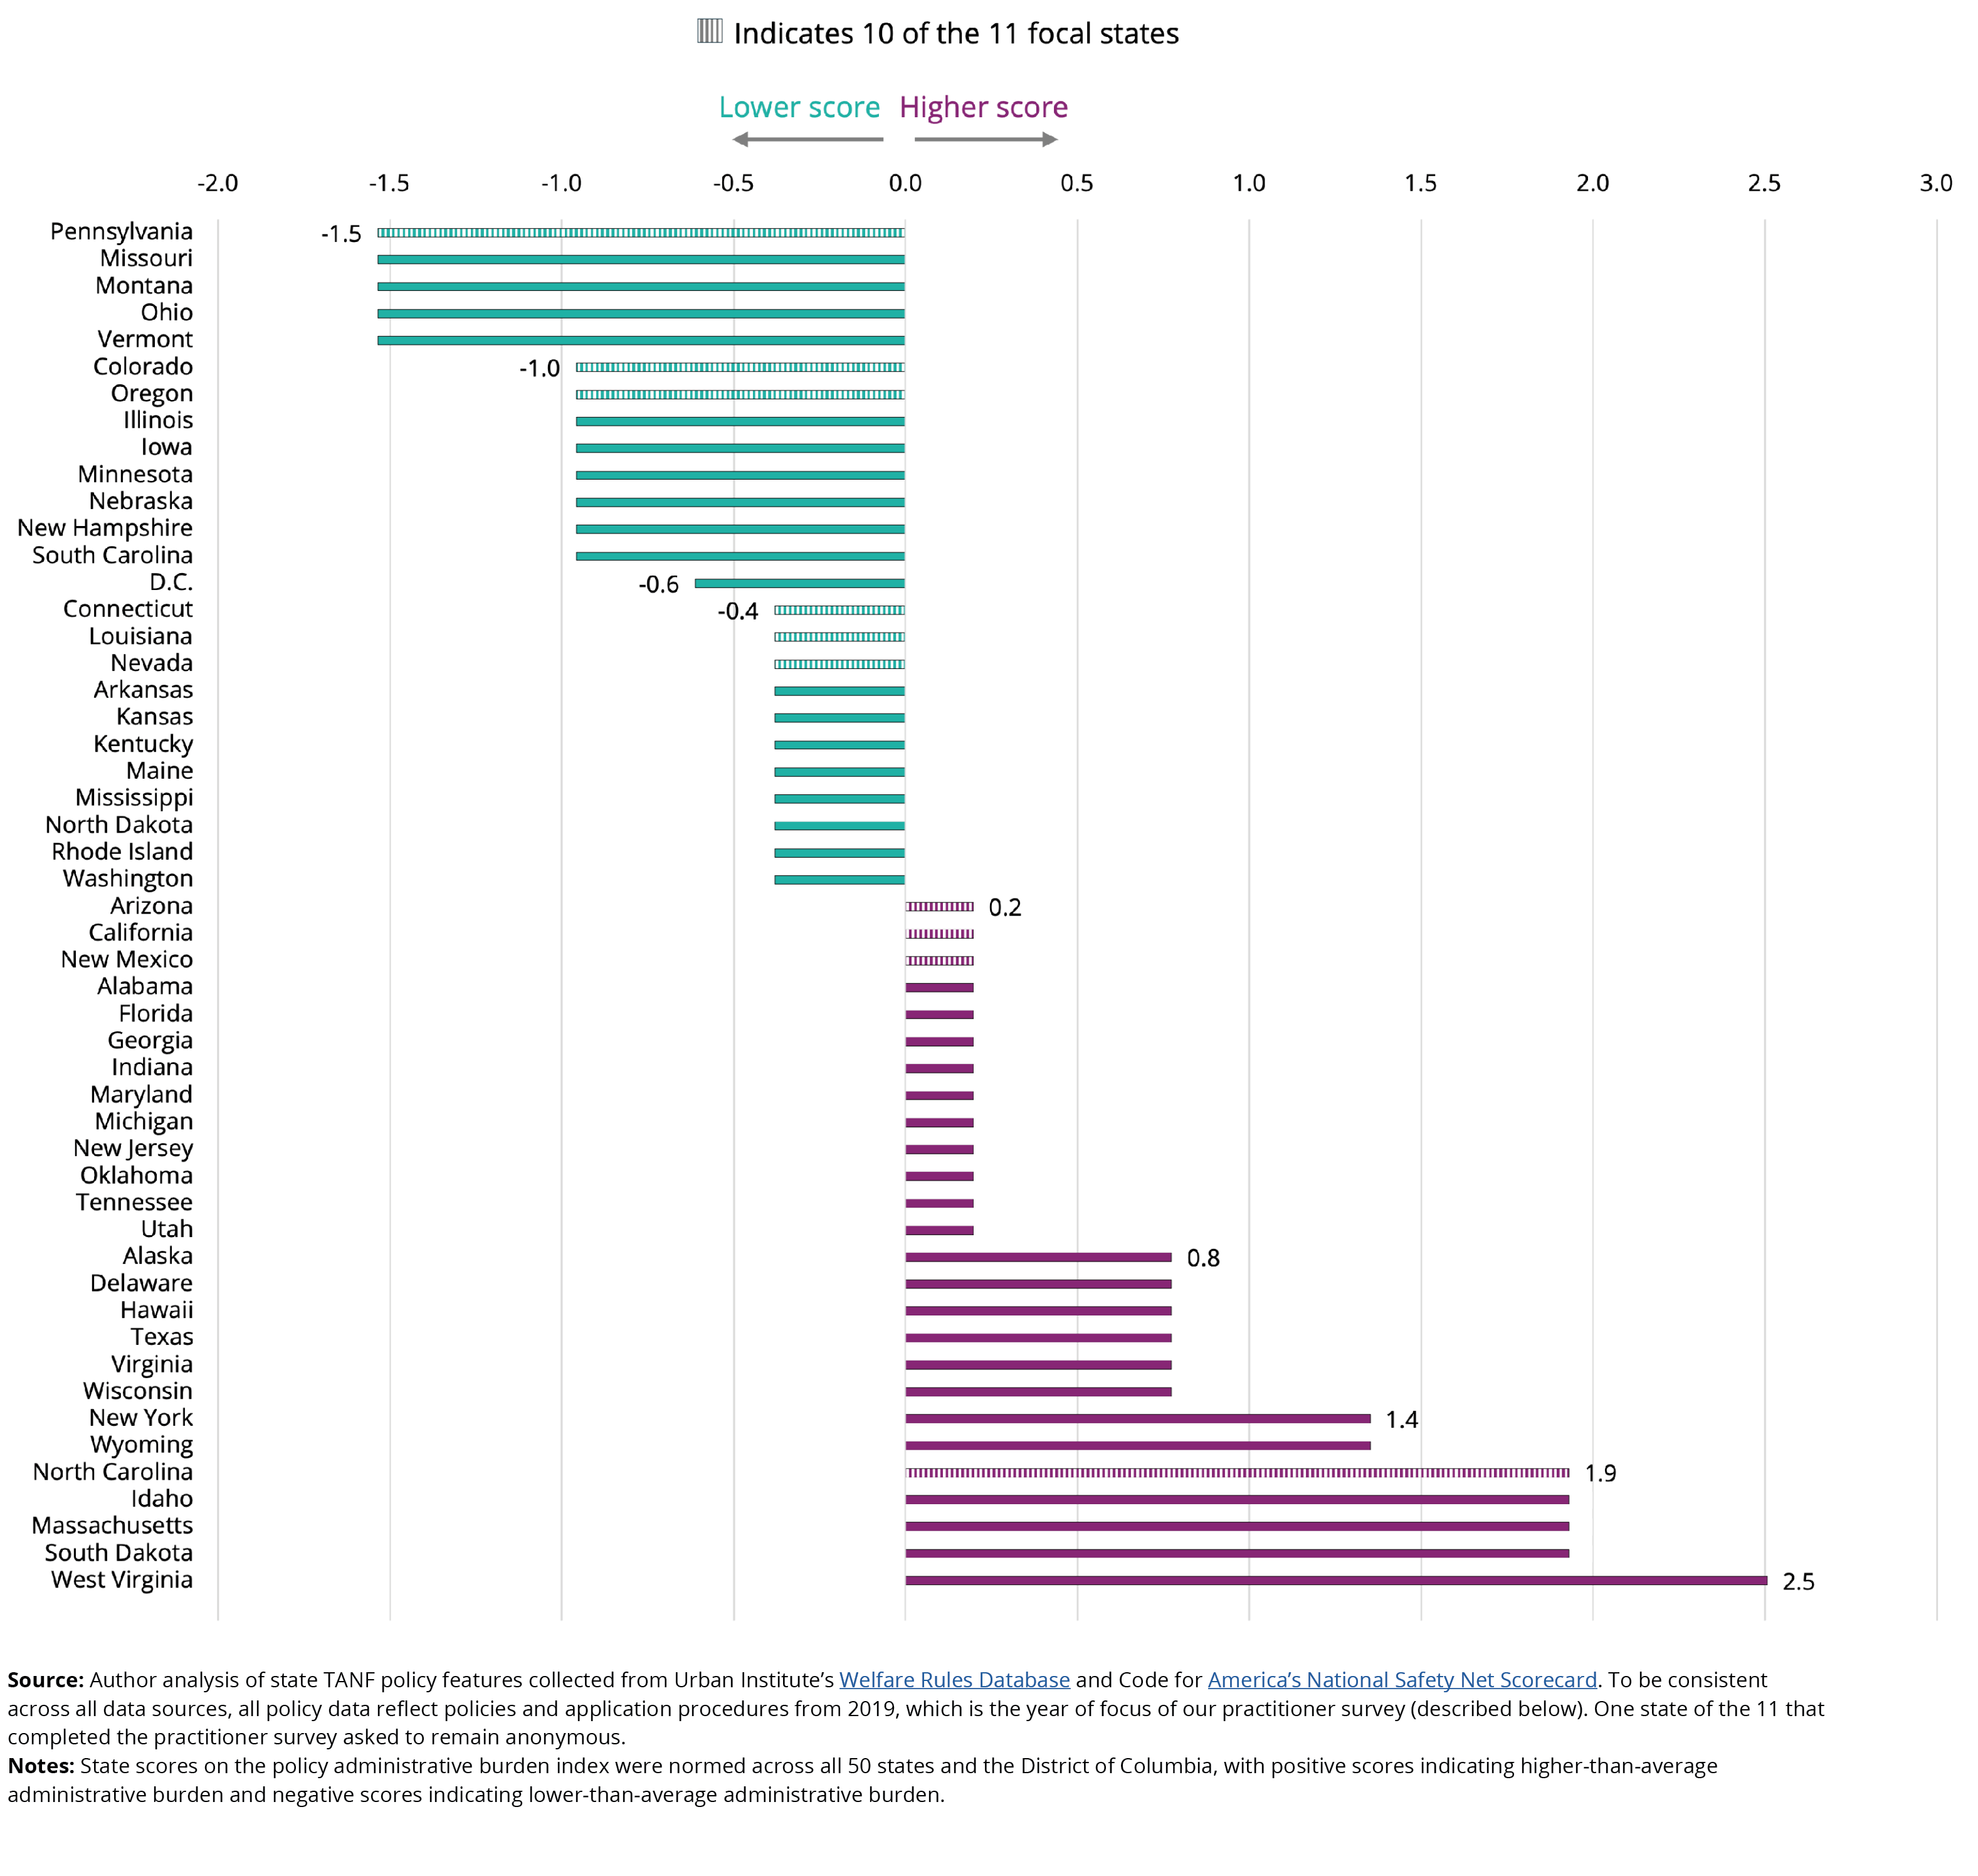
Source: Author analysis of state TANF policy features collected from Urban Institute’s Welfare Rules Database and Code for America’s National Safety Net Scorecard. To be consistent across all data sources, all policy data reflect policies and application procedures from 2019, which is the year of focus of our practitioner survey (described below). One state of the 11 that completed the practitioner survey asked to remain anonymous.
Notes: State scores on the policy administrative burden index were normed across all 50 states and the District of Columbia, with positive scores indicating higher-than-average administrative burden and negative scores indicating lower-than-average administrative burden.
Figure A-2. State-level variation in TANF policy administrative burden, overall and for 20 states with the largest Latino populations
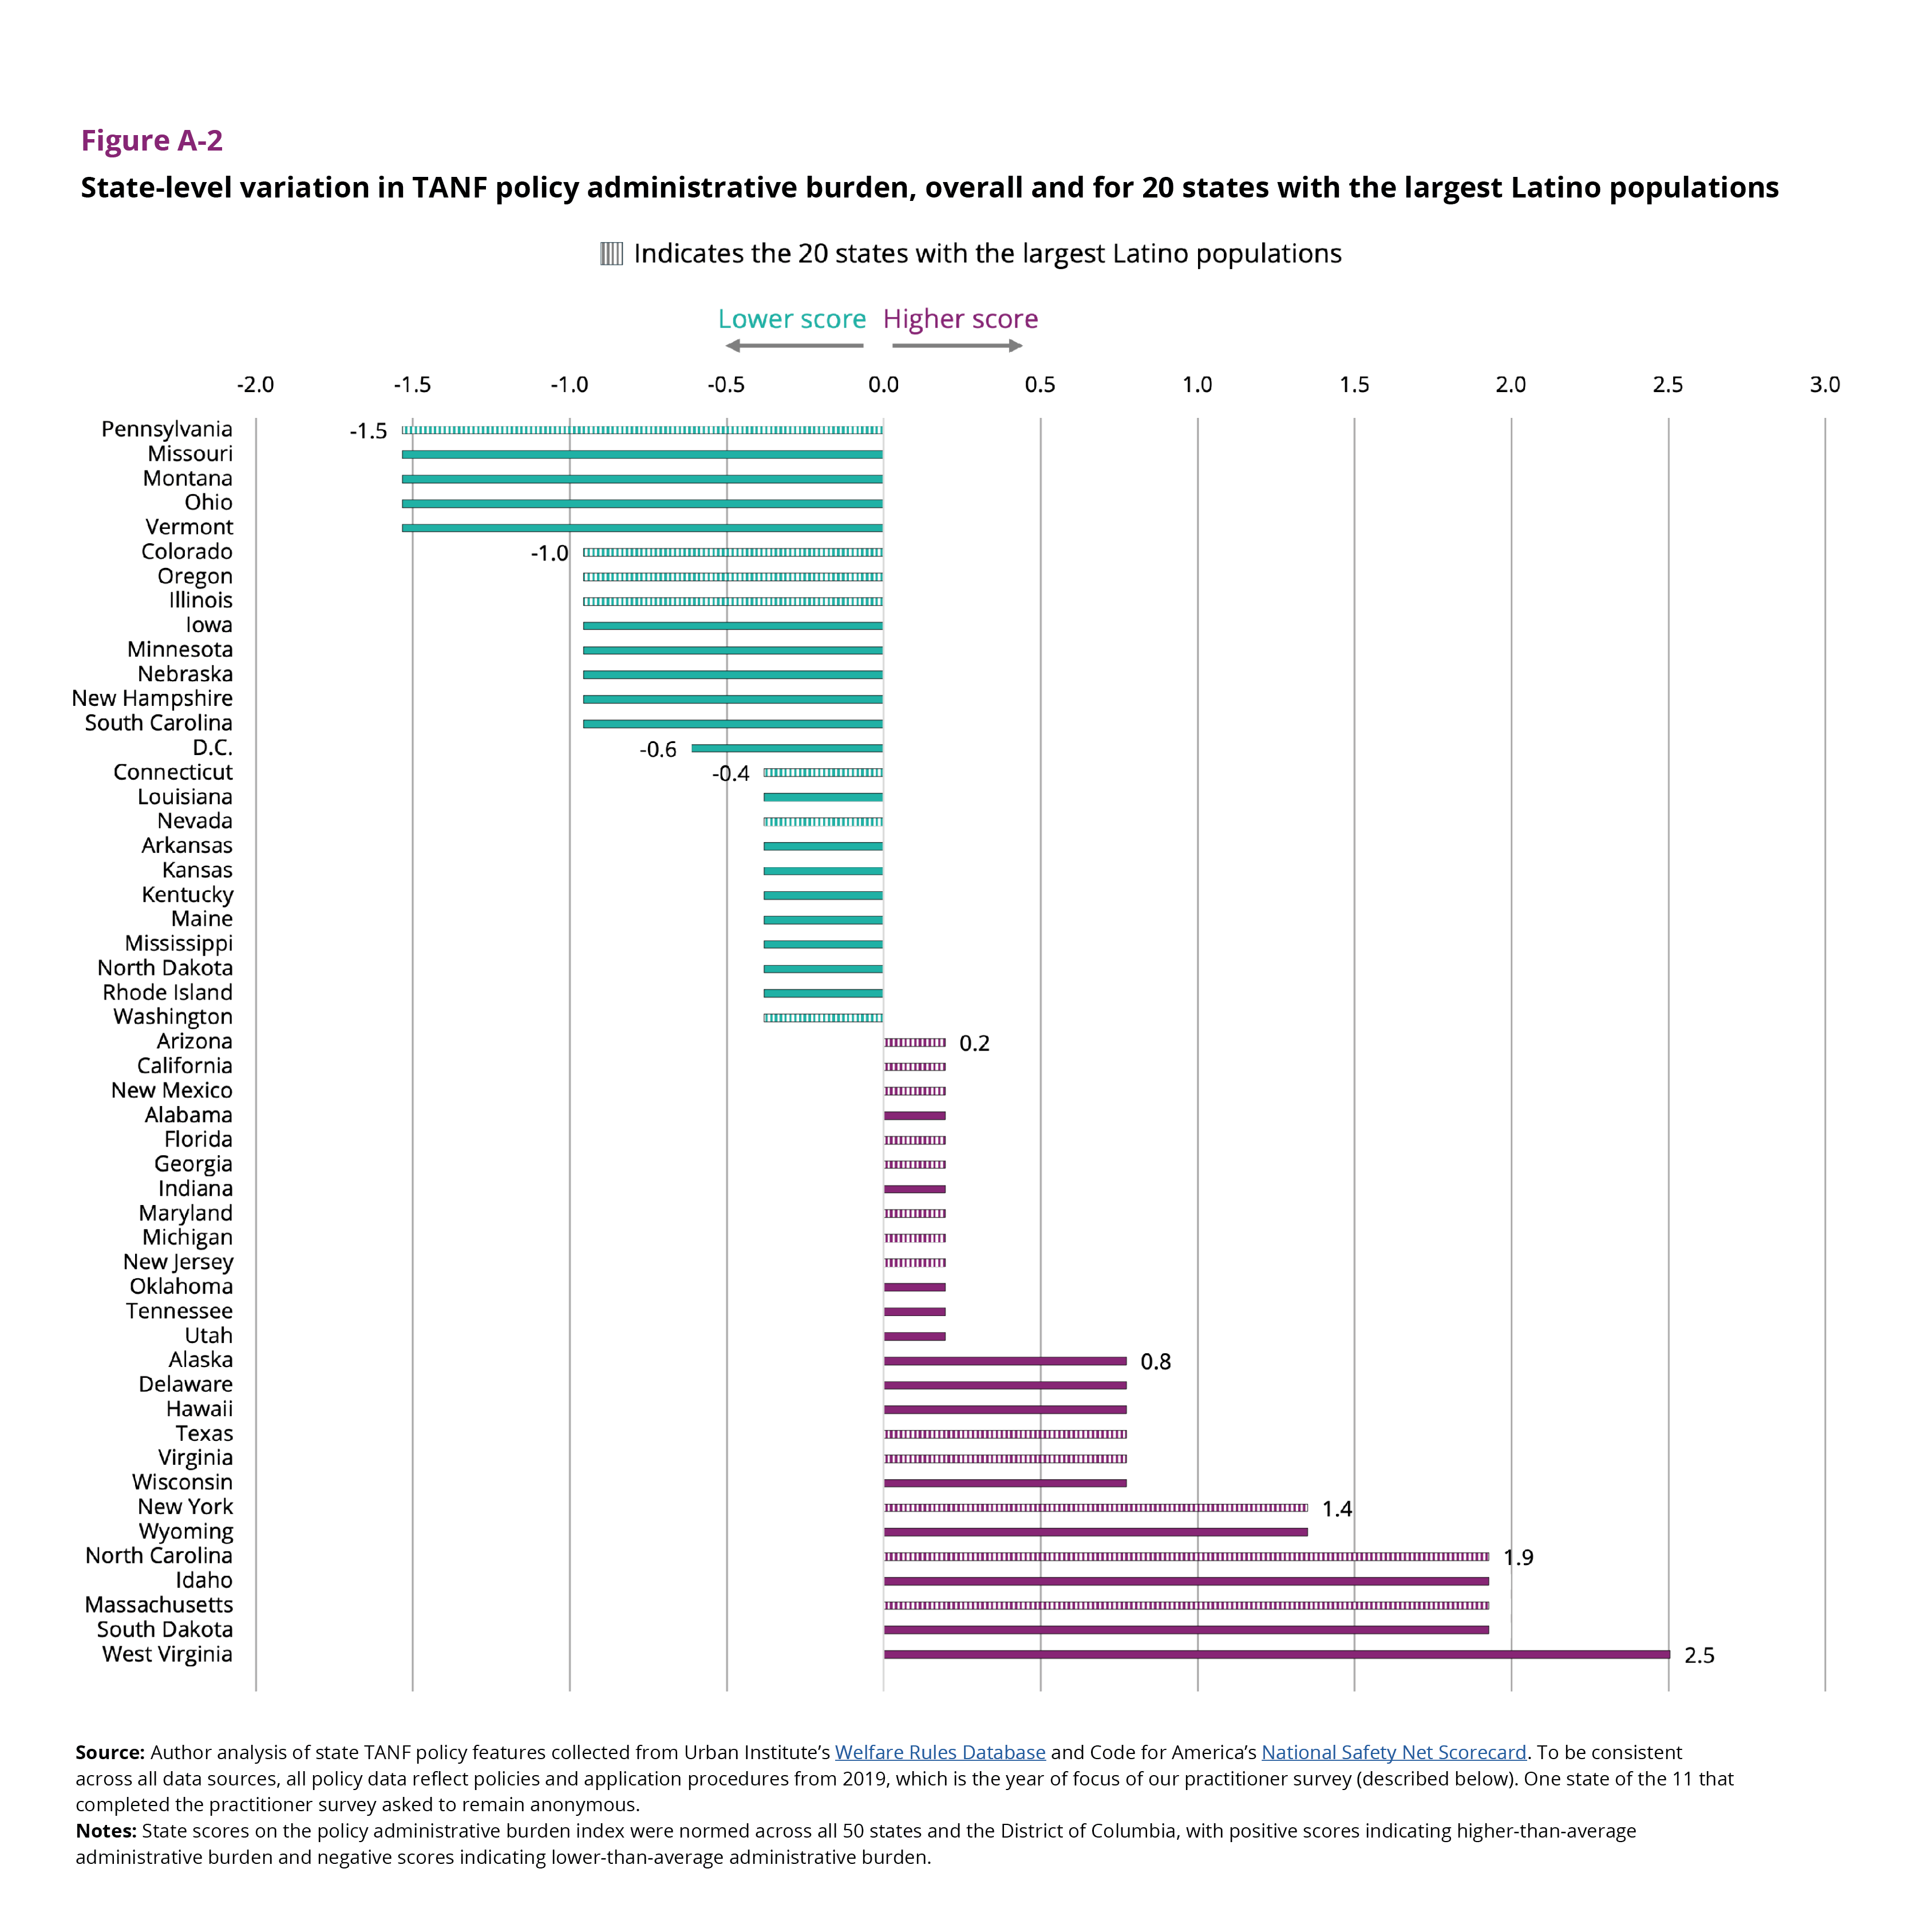 Source: Author analysis of state TANF policy features collected from Urban Institute’s Welfare Rules Database and Code for America’s National Safety Net Scorecard. To be consistent across all data sources, all policy data reflect policies and application procedures from 2019, which is the year of focus of our practitioner survey (described below). One state of the 11 that completed the practitioner survey asked to remain anonymous.
Notes: State scores on the policy administrative burden index were normed across all 50 states and the District of Columbia, with positive scores indicating higher-than-average administrative burden and negative scores indicating lower-than-average administrative burden.