Apr 5, 2023
Hispanic Family Facts
Latino Households With Children Continued to Experience Pandemic-Related Disruptions to Their Child Care Arrangements
Author:

Introduction
The year from Summer 2021 to Summer 2022 was marked by the rollout of COVID vaccines for adults and children, the reopening of schools, the spread of the Omicron variant, and the emerging “new normal” of the COVID-19 pandemic. For this new analysis, the National Research Center on Hispanic Children & Families (the Center) used new data from the Household Pulse Survey (HPS) to examine patterns of child care arrangements that affected Latino households with children in the United States.
Latino Households Faced Persistent Disruptions
From Summer 2021 to Summer 2022, disruptions in child care—defined as the inability of any children in a household to attend a care arrangement because of closure, lack of availability or affordability, or concerns about safety—remained prevalent among Latino households with children under age 12, particularly those with young children under age 5 (Figure 1). Among the latter group of households, rates of child care disruptions hovered around or over 30 percent and temporarily surged to 40 percent in December 2021, when COVID cases spiked as a result of the Omicron variant. Among Latino households with only school-age children (ages 5 to 11), rates of child care disruptions declined when most schools reopened in Fall 2021; increased in the winter, but by less than among Latino households with young children; and then plateaued around 17 percent in Spring and Summer 2022.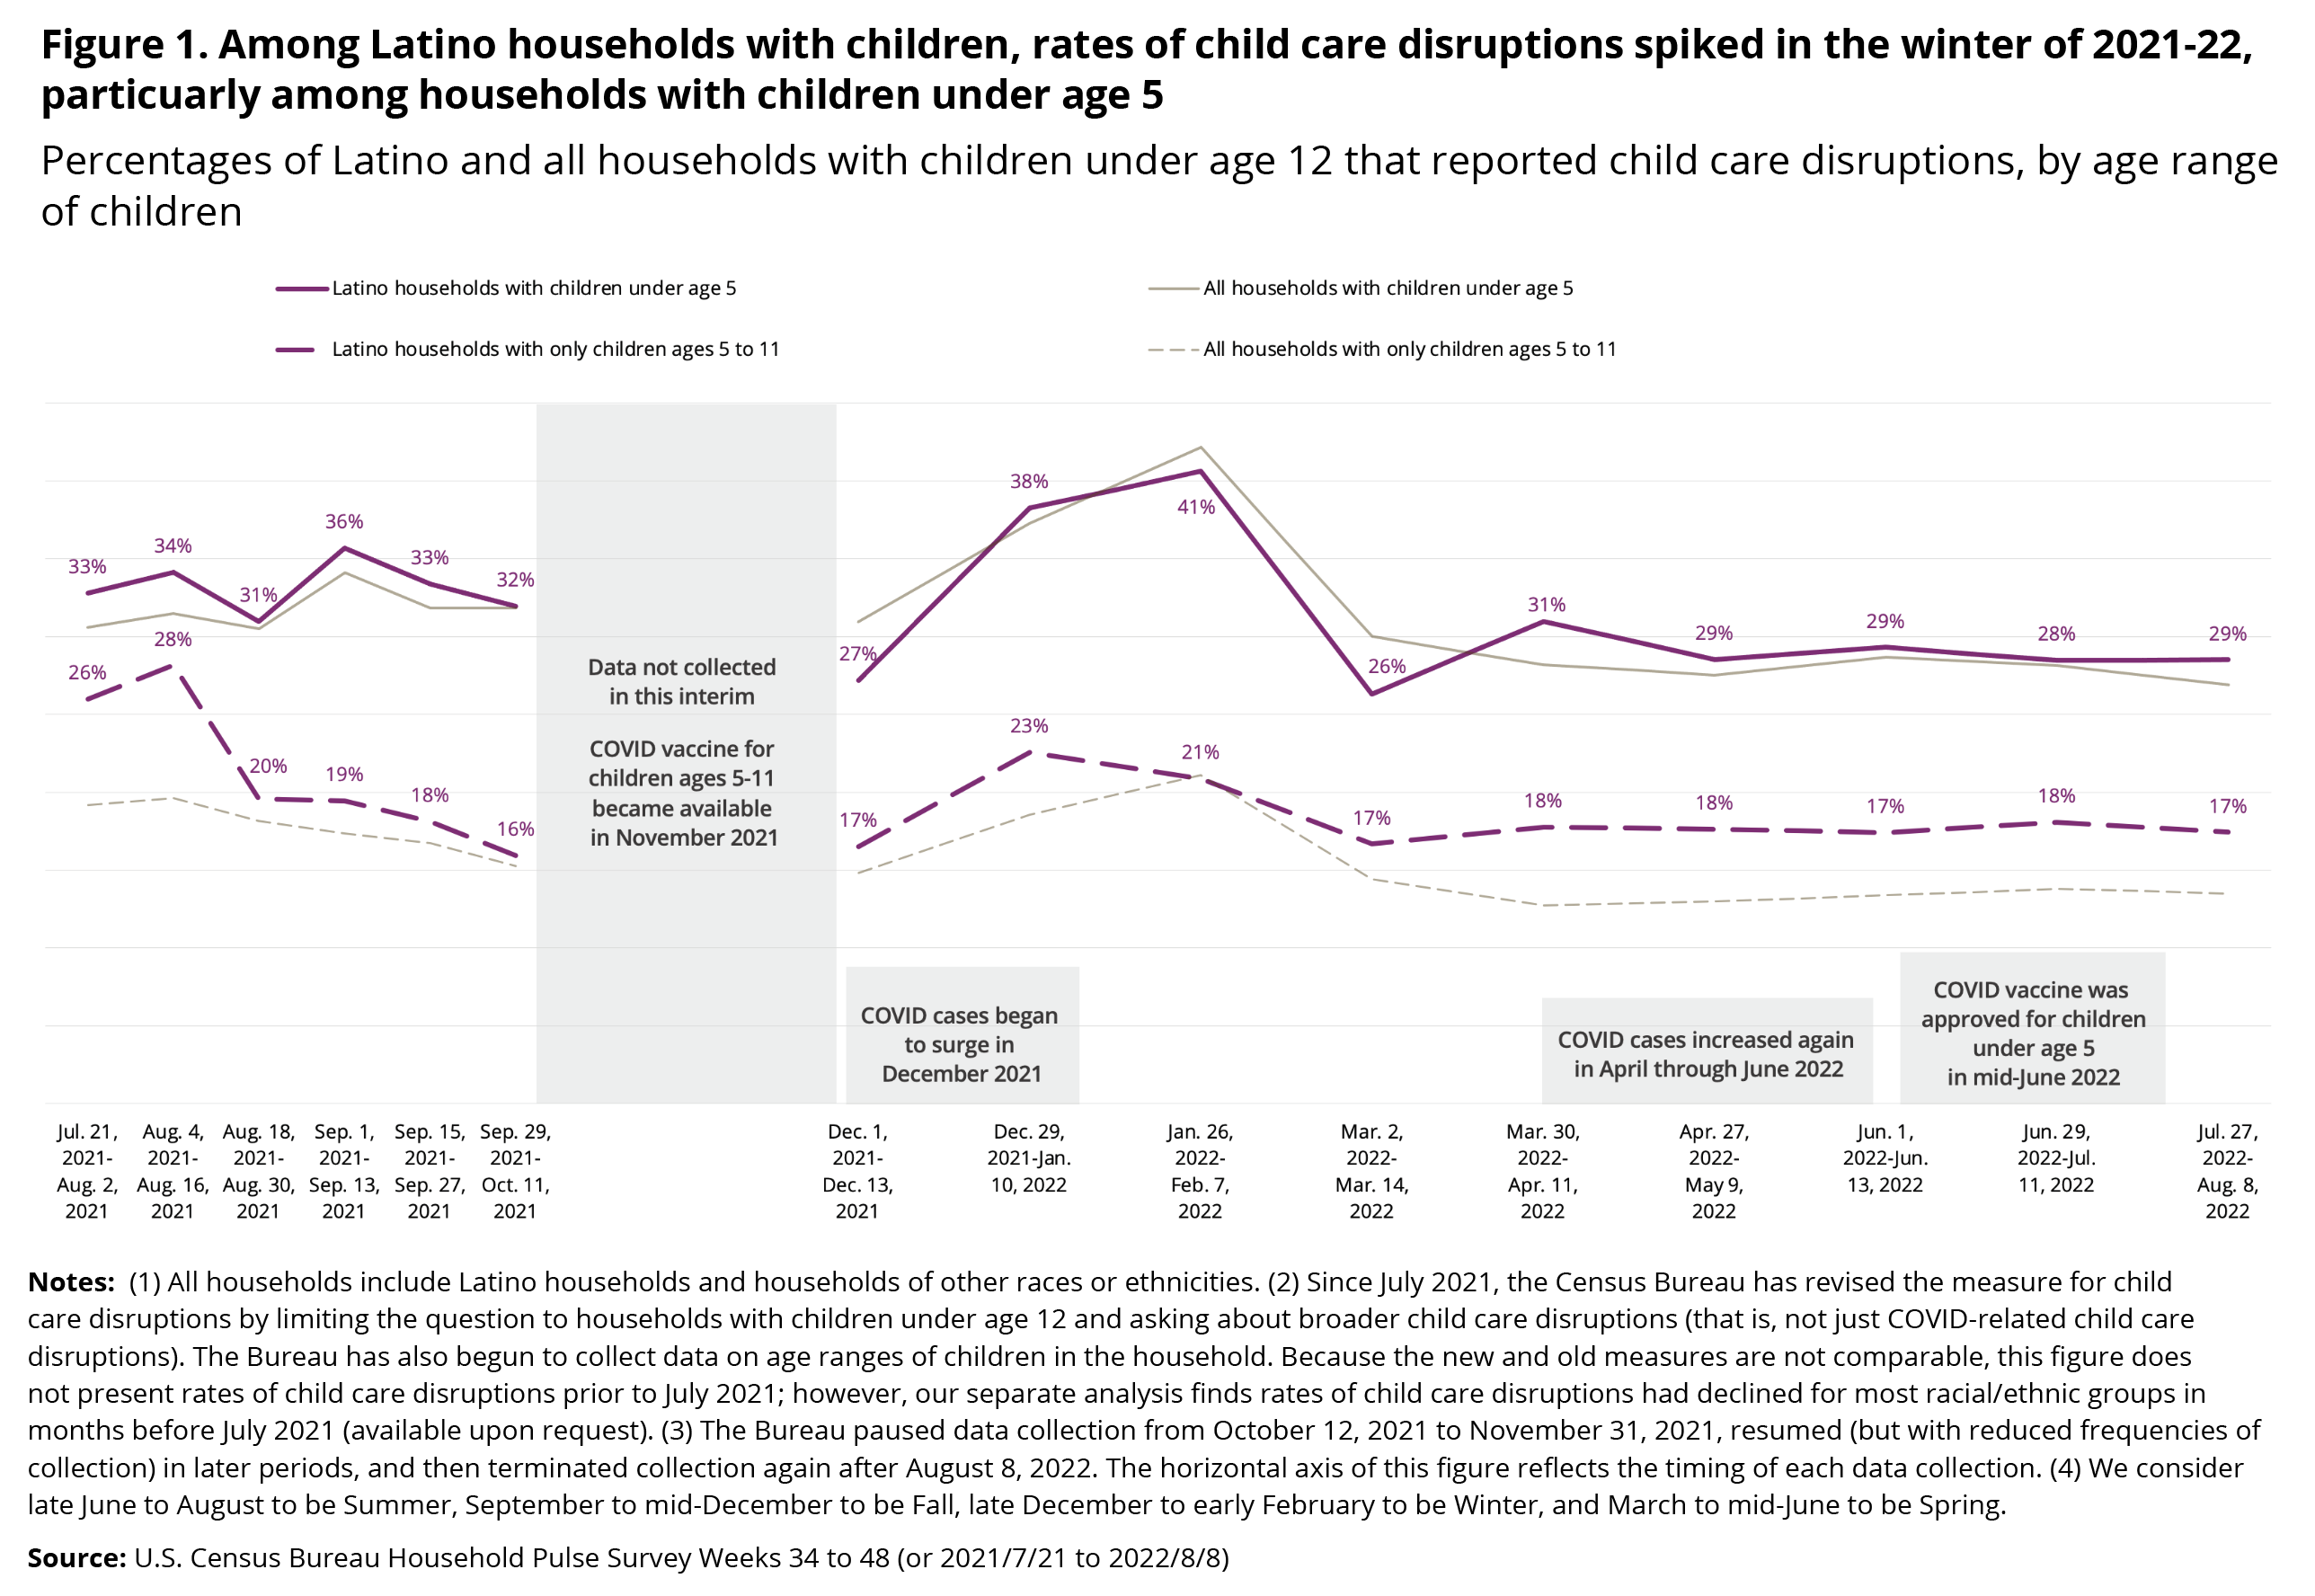
Latino Households Disproportionately Made Costly Responses to Disruptions
From Summer 2021 to Summer 2022, Latino households with children under age 12 were about as likely as all households with children to experience child care disruptions. However, the ways in which households responded to those disruptions appear to be more costly to Latino households who, as in our previous analysis, remained less likely to use paid leave and more likely to lose or leave a job in response to disruptions (Figure 2).
Households that experienced child care disruptions reported one or more strategies or responses to address those disruptions. In 2022, relative to all households that experienced disruptions, a smaller percentage of Latino households used paid leave (26% vs. 34%) or supervised their children while working (19% vs. 27%), and a higher share reported leaving or losing their job (24% vs. 19%).
Comparing 2022 to 2021, a larger percentage of Latino households cut work hours (33% vs. 26%), used paid leave (26% vs. 21%), and left or lost their job (24% vs. 20%) to respond to disruptions in child care. Cuts in work hours may include paid or unpaid leave or other adjustments in work hours to meet child care needs
Understanding Trends in Disruptions and Latino Households’ Responses
Child care disruptions may negatively affect Latino households to a greater extent than their peers, even when the prevalence of disruptions is similar between household types. For example, a low-income Latino household may face longer disruptions if they are unable to afford alternative care arrangements. In addition, cutting work hours to respond to care disruptions may translate into foregone earnings for Latino households, which often include workers who have little paid time off or who work in part-time jobs. A caregiver’s decision to leave a job might be related to their lack of telework or paid leave that would otherwise allow them to address child care issues while retaining their jobs.
While the Household Pulse Survey data used in this analysis provide the first nationally representative data for examining fluctuations in child care disruptions among all households with children under age 12, they do not allow a direct examination of either the nature of care disruptions or the reason for a household’s response. This analysis suggests the need for additional data to further examine structural inequality in the labor market, including factors such as access to paid sick leave, paid family leave, and flexible work arrangements (e.g., telework and flextime); households’ ability to access child care; or school and care policies such as school hours and stay-home policies. These structural factors affect whether and how Latino households experience child care disruptions, and how households that do face care disruptions are able to respond.
About this snapshot
This data snapshot is part of a series documenting how Latino children, families, and households have been faring since the onset of the COVID-19 pandemic. Each snapshot draws from the latest publicly available data sources to examine a specific domain of child and family well-being and provide a brief overview of social and policy context relevant to the findings. Recent snapshots have focused on mental health, poverty, housing, food, and multiple hardships experienced by Latino households with children. This snapshot provides an update to an earlier one examining child care and work-related disruptions in Spring 2021. This snapshot extends our earlier analysis to include later data through Summer 2022.
Methodology
For this analysis, the Center used data from the Household Pulse Survey (HPS), a U.S. Census Bureau initiative that has collected nationally representative data since April 2020 on the economic and health well-being of households and individuals in the United States during the COVID-19 pandemic. The analysis examines the Summer 2021 to Summer 2022 timeframe because it covers one year beginning with the endpoint of the timeframe covered in our last data snapshot on this topic, and comes before the Bureau suspended collection of data on child care disruptions.
Figure 1 summarizes the prevalence of child care disruptions separately for Latino and all households with children under age 12. Statistics about all households (comprising all races and ethnicities) are presented to offer benchmarks for rates of disruptions and responses to disruptions among Latino households. Latino households are defined as households in which the respondent self-identified as having a Latino, Hispanic, or Spanish origin.
The analytic sample is restricted to 198,448 households with children under age 12 that were asked about child care disruptions from July 21, 2021 to August 8, 2022. We considered households to have experienced child care disruptions if they offered an affirmative response to the question: “At any time in the last 4 weeks, were any children in the household unable to attend daycare or another child care arrangement as a result of child care being closed, unavailable, unaffordable, or because you are concerned about your child’s safety in care?”; we reported no disruptions if they answered no. This question also instructed respondents to include before-school care, after-school care, and all other forms of child care that were unavailable.
In our analysis, we identified close to 30 percent (weighted) of households with children under age 12 that did not provide a yes or no response to the question across all periods. Before March 30, 2022, households did not have the option of reporting “not applicable” to the question on child care disruptions. “Question seen but category not selected” was flagged in the data for 20 percent of households, and “missing or did not report” was flagged for another 8 percent of households. Since March 30, 2022, “question seen but category not selected” has been flagged for 1 percent of households; “missing or did not report” has been flagged for 9 percent of households; and “not applicable” has been flagged for another 20 percent of households. The number of households flagged as “question seen but category not selected” in the first period who would have selected “not applicable” had the option been available is not known, so we considered all three categories missing reports of child care disruptions and conducted multiple imputation for missingness, adjusting for correlates of child care disruptions. This approach also counts all households with children under age 12 in the denominator for rates of disruptions and assumes all of them need some type of child care, including formal, informal, and parental care. The multiple imputation procedure considers the following factors: race/ethnicity, gender, age, marital status, educational attainment, employment, and health insurance status of the respondent; the presence of adults other than the respondent (and his/her spouse); the age of children in the household; whether a household member teleworked; household income; and the household’s metropolitan area and state of residence. Figure 1 summarizes rates of child care disruptions based on this imputation. These results do not vastly differ from unimputed rates of child care disruptions with all three types of missings dropped.
Figure 2 presents original (unimputed) reports of responses to child care disruptions that households experienced. For this figure, we further limited the sample to 34,428 households with child care disruptions, which is about 17 percent (weighted) of all households with children under age 12. Respondents reporting any child care disruptions were asked to indicate whether, in order to care for their children, any adult in the household (including themselves) (1) took unpaid leave; (2) used vacation, sick days, or other paid leave; (3) cut hours; (4) left a job; (5) lost a job; (6) did not look for a job; (7) supervised one or more children while working; (8) other; or (9) none of the above. Respondents were able to select all responses that applied. For this data point, given the overlap of the categories, we combined responses for losing a job and leaving a job: 47 percent of respondents who lost a job also reported they left a job. We also combined households with children under age 5 and households with only school-age children in Figure 2, since similar time trends have been found between these groups. The Census Bureau’s household weights were applied to all estimates.
| Title | Study period | Data source | Analysis |
|---|---|---|---|
| Disruptions to child care arrangements and work schedules for low-income Hispanic families are common and costly Ferreira van Leer et al., 2021 |
2012 | National Survey of Early Care and Education | Types of child care disruptions and associated consequences for parents’ work |
| Childcare and employment disruptions in 2020 among caregivers of children with and without special health care needs Easterly et al., 2022 |
2016 – 2020; the 2020 data was collected from July 2020 to January 2021 | National Survey of Children’s Health | Employment disruption related to child care by child status of special health care needs |
| Five-year trends in U.S. children’s health and well-being, 2016-2020 Lebrun-Harris et al., 2022 |
2016 – 2020; the 2020 data was collected from June or July 2020 to January 2021 | National Survey of Children’s Health | Prevalence of parents quitting, declining, or changing jobs because of child care problems |
| Child care affordability, accessibility, and the costs of disruption Neckerman et al., 2021 |
2019 | The Early Childhood Poverty Tracker Study to New York City households with young children ages 0-3 | Child care disruptions that led to job turnover or that hindered work advancement by income, education, race and ethnicity, and family structure |
| Managing disruptions in early care and education: Lessons from COVID-19 DeMeo Cook et al., 2022 |
September 2019 –August 2020 | A survey and interviews of families whose children entered kindergarten in 2019 and 2020 | Patterns of child care in the year prior to kindergarten |
| A rising share of working parents in the U.S. say it’s been difficult to handle child care during the pandemic Igielnik, 2021 |
March and October, 2020 | Survey of U.S. adults conducted in October 2020 | Changes in child care responsibilities and challenges |
| Effects of daily school and care disruptions during the COVID-19 pandemic on child mental health Gassman-Pines et al., 2022 |
Fall 2020 | A survey of hourly service-sector workers with a young child from a major U.S. city | Child care disruptions by modality (remote, in-person, etc.) and race/ethnicity |
| Childcare remains out of reach for millions in 2021, leading to disproportionate job losses for Black, Hispanic, and low-income families Koltai et al., 2021 |
July to October 2021 | U.S. Census Bureau’s Household Pulse Survey | Child care disruptions by income and race/ethnicity and losing or leaving a job in response to disruptions |
| For low-income parents, no day care often means no pay The Washington Post |
August 2021 – January 2022 | U.S. Census Bureau’s Household Pulse Survey | Child care disruptions by income level |
| Families with young children are losing $13 billion a year while child care sector struggles during the pandemic The Century Foundation, 2022 |
Fall 2021 | U.S. Census Bureau’s Household Pulse Survey | Responses to child care disruptions by gender and race/ethnicity |
| Resilient but not recovered: After two years of the COVID-19 crisis, women are still struggling Tucker & Vogtman, 2022 |
December 2021 | U.S. Census Bureau’s Household Pulse Survey | How often women reported child care disruptions |
Suggested citation: Chen, Y. (2023). Latino households with children continued to experience pandemic-related disruptions to their child care arrangements. National Research Center on Hispanic Children & Families. https://doi.org/10.59377/629d5724y